This website uses cookies as well as similar tools and technologies to understand visitors’ experiences. By continuing to use this website, you consent to Columbia University’s usage of cookies and similar technologies, in accordance with the Columbia University Website Cookie Notice.
Two economic planning documents released at the March meeting of China's National People’s Congress include the term "energy powerhouse" for the first time.
It has been a tumultuous 24 hours for the global energy landscape. Yesterday, the United Arab Emirates sent shockwaves through the oil industry by announcing its withdrawal from...
We are the premier hub and policy institution for global energy thought leadership. Energy impacts every element of our lives, and our trusted fact-based research informs the decisions that affect all of us.
Fact sheet data source: US Energy Information Administration, Residential Energy Consumption Survey [RECS] 2020 and 2024, https://www.eia.gov/consumption/residential/data/2024/
Key Takeaways
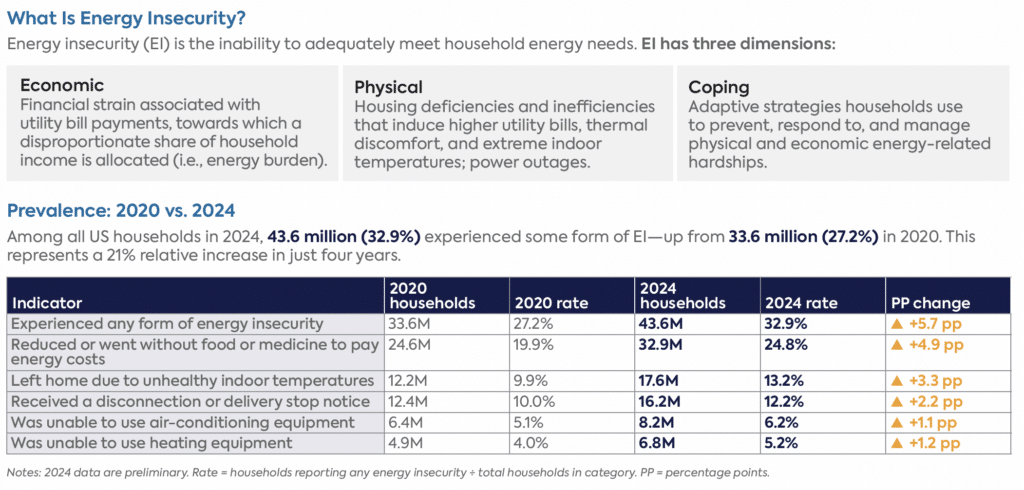
Energy insecurity reached its highest recorded level in 2024 across all indicators.
The indicator with the largest percentage point increase from 2020 to 2024 was households trading food or medicine for energy bills: rising from 19.9% to 24.8%.
The steepest increases occurred among demographic groups previously less exposed. Middle-income households ($60,000–$100,000/year) saw a 12-point jump (20.1% to 32.1%) in EI. Non-Hispanic White households rose 6.3 points, more than double the increase seen among historically, and still highly, exposed groups including Blacks, Hispanics, and Native Americans.
Working-age householders (under 60) experienced the largest age-group increase, at +6.5 points, while seniors (60+) saw a 4.8-point rise, such that now 1 in 4 (up from 1 in 5) seniors are exposed to EI. Households with children reached a new EI peak of 42.3% in 2024.
Renters remain far more exposed than owners (47.8% versus 25.7%), but both groups worsened at similar rates. Rural dwellers saw a 6.9-point increase, while urban residents experienced a more modest rise (28% in 2020 to 33% in 2024).
While energy efficiency measures can ease EI, even households in adequately insulated homes and with double-pane windows saw substantial gains (~+6 points)—though this increase was not as high as for homes with single-pane windows (+7.0 points).
Warm-weather regions posted the sharpest increases. The mixed-dry/hot-dry region (Southwest) rose 10 points to 41.5%—the largest of any climate category. The hot-humid region (Southeast/Gulf Coast) rose 5.5 points to 35.6%, while cold-weather regions saw smaller gains (+4.7 points).
Data gaps: The 2024 RECS data are preliminary and already likely undercount current conditions, as they predate recent energy price volatility. Compared to 2020, 2024 data show a substantial rebound and widening crisis following the expiration of pandemic-era protections, inflation, and growing economic pressures.
Implications: More frequent data collection and quicker public release are needed to track this escalating crisis. Actionable responses include utility disconnection protections, expanded financial assistance, and enhanced home energy programs targeting insulation, windows, and heating and cooling equipment upgrades.
This report explores how residents of North Lawndale, a predominantly Black and historically under-resourced neighborhood on Chicago’s West Side, experience the compounded effects of heat waves and power outages.
Reports
by Qëndresa Krasniqi, Helen Yibrah, Rachel Scheu + 2 more • July 10, 2025