This website uses cookies as well as similar tools and technologies to understand visitors’ experiences. By continuing to use this website, you consent to Columbia University’s usage of cookies and similar technologies, in accordance with the Columbia University Website Cookie Notice.
Reporting in the New York Times suggests a key element in the Trump administration's Russia-Ukraine peace plan involves Europe resuming Russian gas imports.
After years of trying, the US may be on the cusp of a nuclear renaissance. Commercial nuclear generation began in this country in 1958. Today, the US has...
Registration is closed. Join Women in Energy and Pillsbury in Washington, D.C., for a conversation examining the key trends and developments shaping the energy industry, where opportunities are...
Event
• Pillsbury
1200 Seventeenth Street NW, Washington, DC 20036
About Us
We are the premier hub and policy institution for global energy thought leadership. Energy impacts every element of our lives, and our trusted fact-based research informs the decisions that affect all of us.
This white paper was produced as part of the research program of the Energy Opportunity Lab at the Center on Global Energy Policy and was made possible with support from the Rockefeller Foundation. It represents the research and views of the authors. It does not necessarily represent the views of The Rockefeller Foundation, the Center on Global Energy Policy, or Columbia University. The piece may be subject to further revision.
The authors express their appreciation to the members of the High-Level Panel on Universal Energy Abundance, whose leadership is helping to bring greater attention to this important topic, as well as to the Rockefeller Foundation. The authors wish to express their respect and admiration for the many individuals and organizations that have dedicated their time and creativity to closing gaps in access to electricity and clean cooking systems. The authors are also grateful to the publications and communications teams of the Center on Global Energy Policy (CGEP). The authors also thank Katie Auth (Energy for Growth Hub), Andrew Herscowitz (Mission 300 Accelerator), Gautam Jain (CGEP), Luisa Palacios (CGEP), Andrew Kamau (CGEP), Ali Saar (International Energy Agency), Daniel Wetzel (IEA), and two anonymous reviewers for their thoughtful comments on earlier drafts of this white paper. Any shortcomings are the responsibility of the authors.
Universal energy abundance (UEA) refers to a state of development in which supplies of reliable and affordable energy meet the full range of a country’s needs and facilitate greater socioeconomic opportunity and well-being.
For low- and middle-income countries (LMICs), achieving UEA requires dramatically expanding supplies of not only electricity but also fuels and feedstocks.
However, since LMICs have different starting points—shaped by variations in natural endowments, non-energy infrastructure (such as roads, ports, and railways), and institutional, workforce, and financial capacities—each country’s pathway toward UEA must be tailored to its particular context, reflecting the priorities determined by that country.
Historical data suggest that achieving UEA in LMICs will require significant effort and time, underscoring the importance of effective planning, sound technology choices, substantially greater investment, and cooperation with domestic and international stakeholders.
Introduction
Most low- and middle-income countries (LMICs)[i] face a binding constraint on their growth: insufficient, unreliable, and unaffordable energy. This constraint impedes poverty reduction, business creation and growth, reliable social services delivery, and the expansion of economic opportunity. Roughly 20 years of focus on energy access—providing modest, first-time electricity access and cleaner cooking systems to households and other last-mile consumers—have yielded important gains. Hundreds of millions of people have gained access to at least basic energy services. Yet what LMICs need for socioeconomic transformation—what they need for prosperity—extends far beyond energy access goals: They need universal energy abundance (UEA), a state of development in which supplies of reliable and affordable energy meet the full range of the country’s needs and facilitate greater socioeconomic opportunity and well-being.
This white paper introduces the concept of UEA, distinguishes it from existing energy access frameworks, proposes ways to measure progress, and identifies the tensions and challenges involved in pursuing it. Rather than being the final word on UEA, it is intended to establish an initial framework for discussion and further research.
1. A More Ambitious Goal
Energy is essential for economic development. For many LMICs, and even some parts of high-income countries, insufficient, unreliable, and unaffordable energy remains a binding constraint on growth and prosperity. UEA seeks to remove this constraint, but the scale of ambition implied in this objective should not be underestimated.
Efforts to promote energy access—defined as “a household having reliable and affordable access to both clean cooking facilities and to electricity”[ii]—have made significant progress in bringing power to many households and other consumers such as small-scale shops, firms, and clinics.[iii] Nonetheless, population growth has often outpaced the rate of new access. Consequently, some 655 million people still lack access to energy as of 2024, and 2 billion people—most of them located in sub-Saharan African countries—continue to rely on highly polluting cooking fuels and systems.[iv]
Policymakers and practitioners have increasingly recognized that a focus on energy access—though vital—is insufficient because it does not deliver energy supply at the scale that LMICs need for widespread development of their economies. The United Nations’ Sustainable Development Goal 7 (SDG 7), adopted in 2015, set a target of universal access to “affordable, reliable, sustainable and modern energy” by 2030.[v] SDG 7 did not specify the level of energy required to meet this goal, though later efforts to measure progress, such as the World Bank’s Multi-Tier Framework (MTF),[vi] have moved beyond a binary definition of energy access toward a tiered system that incorporates certain attributes of access, including reliability, affordability, and household appliance use. A current definition of energy access requires only 50–100 kilowatt-hours (kWh) per person per year—enough to power a couple of light bulbs and charge a mobile phone.[vii] By this measure, a country could meet the threshold for universal electrification even as unreliable grids force its hospitals to run on expensive diesel generators, its factories to operate below capacity, and its farmers to irrigate by hand.
Many experts and policymakers have called for energy access goals to be defined in quantitative terms and set at much higher levels of energy provision than before. The Energy for Growth Hub’s Modern Energy Minimum (MEM), for instance, establishes a global benchmark of 1,000 kWh of electricity consumption per person per year, with 300 kWh allocated to household use and 700 kWh to industrial and commercial use.[viii] This consumption level corresponds to a gross national income per capita of $2,500 per year, which is roughly the average among countries classified by the World Bank as lower middle income. The Energy for Growth Hub’s analysis also underscores the critical point that a country’s income and electricity consumption are closely correlated: No high-income country has low electricity use, and no country with low electricity use has achieved high-income status.
The introduction of MEM advanced the debate over the level of energy supply LMICs need to realize meaningful socioeconomic outcomes. But MEM’s focus on electricity leaves critical elements of countries’ full energy systems out of view. This is one of the key shortcomings that the idea of UEA seeks to address, as discussed in the next section.
2. Defining UEA
For national policymakers deciding where to direct scarce public resources, a fundamental question that often emerges is whether the country’s energy system can support the economic future that its people are trying to build or whether it will constrain it. For business leaders assessing whether to invest in a new facility, the question is whether they can count on a reliable and affordable energy supply sufficient to operate competitively. UEA can allow a favorable reply to both questions. The concept is best understood by unpacking each of its three components.
a. Universal
The goal of universality speaks to the objective of serving all parts of a country and all kinds of energy consumers. Achieving UEA requires reaching beyond electricity connections for households and other small consumers. UEA calls for delivering the energy needs of the full range of economic entities whose ability to secure reliable and affordable energy determines whether and how the economy grows. This wider effort must include small and medium enterprises, transportation and logistics networks, agricultural and food production, and large-scale industries, in addition to health and education facilities. Universality means that every part of the economy capable of generating jobs and income—not just every household—has the energy services it needs. As a practical matter, however, achieving universality will take time because energy systems cannot be expanded everywhere at once. This makes short-term prioritization necessary.
b. Energy
The policymaker (and, in some cases, the business leader) mentioned above needs an understanding of all parts of the energy system, not just the electricity system. Current energy access tracking frameworks, however, primarily focus on household electrification and other last-mile customers.[ix] This emphasis reflects practical and historical factors: Electricity is comparatively easy to meter and track, and energy access frameworks—even those that account for institutional and small business energy needs—evolved from the need to track household electricity connections. Yet, based on the latest available data (2023), electricity represents just over one-fifth of global total final consumption (TFC) of energy,[x] and even in countries pursuing greater electrification, electricity’s share has been slow to change. Highly energy-intensive sectors, such as heavy industry (including steel, cement, and chemicals), long-haul transport and shipping, and agriculture, continue to depend heavily on fuels—not just on electricity. If a country’s energy strategy and investment frameworks account only for electricity, they may overlook the constraints and opportunities that matter for industrialization and wider economic development.
c. Abundance
The third component concerns having a sufficient scale of reliable and affordable energy supply to achieve the full range of a given country’s objectives.[xi] Historically, different thresholds of energy use have been associated with different levels of economic development. As a country’s development objectives and economic activities expand, so do the quantities and forms of energy required. Therefore, rather than a binary condition, UEA’s abundance dimension is better understood in terms of tiers of energy use, which are discussed below. The MTF provides a model for this approach, though UEA requires a broader scope.
Together, these three words—universal, energy, and abundance—amount to a more expansive objective than energy access alone—one that spans the entire economy, integrating the need for molecules and electrons, and reflecting a country’s stage of development rather than applying a universal yardstick. However, making UEA actionable for policymakers and investors requires translating it into measurable terms.
3. Measuring Progress Toward UEA
Identifying the best way to measure progress toward UEA is no easy task. A single metric that is easy for the public to understand may obscure vital distinctions, such as whether countrywide average energy use is rising despite persistent system outages or serious supply chain vulnerabilities. On the other hand, a set of metrics that includes multiple data streams may become too intricate to support public consensus around national or subnational targets.
This section examines six aspects of the measurement question: the most appropriate unit of energy; meaningful thresholds for progress; choices about energy data and statistics; where countries currently stand relative to those thresholds; historical experience and what it suggests about the future of a country’s energy sector; and additional metrics that might usefully supplement a single headline figure to provide a fuller picture of the energy system’s contribution to economic opportunity.
a. Unit of Measurement
Because UEA is intended to capture all modern forms of energy that power an economy—molecules as well as electrons—a natural choice of unit is one that measures them on a common basis: the gigajoule (GJ).[xii] A GJ can be converted into liters of diesel, cubic meters of natural gas, or kWh of electricity, making it possible to express a country’s power, fuel, and industrial energy use through a single, composite figure. This, in turn, makes it easier to draw comparisons across countries.
In everyday terms, a GJ is equivalent to:
One person’s sustained heavy manual labor for eight hours per day, every day, for a year.
278 kWh of electricity—roughly what an average US household uses in nine to ten days, or what a mid-sized, 350-liter refrigerator freezer uses in approximately six to eight months, depending on its efficiency rating.
About 27 liters (7 gallons) of gasoline.
The energy in roughly one and a half cylinders (approximately 22 kilograms) of liquefied petroleum gas for domestic cooking.
b. Defining Thresholds
As noted previously, there is no single, settled answer to how much energy enables a desired standard of living. Nonetheless, historical patterns can serve as useful reference points. Vaclav Smil documents the living conditions historically associated with different levels of annual per capita energy supply:[xiii]
About 5 GJ per capita per year: a level associated with basic subsistence, roughly corresponding to conditions in preindustrial Western Europe before 1800 or China in the 1950s.[xiv]
About 40 GJ per capita per year: a level marking the transition from basic subsistence to reliable infrastructure, mechanization, and initial industrialization, roughly corresponding to China in the 1980s or Japan between 1930 and 1950.
About 100–150 GJ per capita per year: a level associated with modern, highly developed economies in Europe and elsewhere.
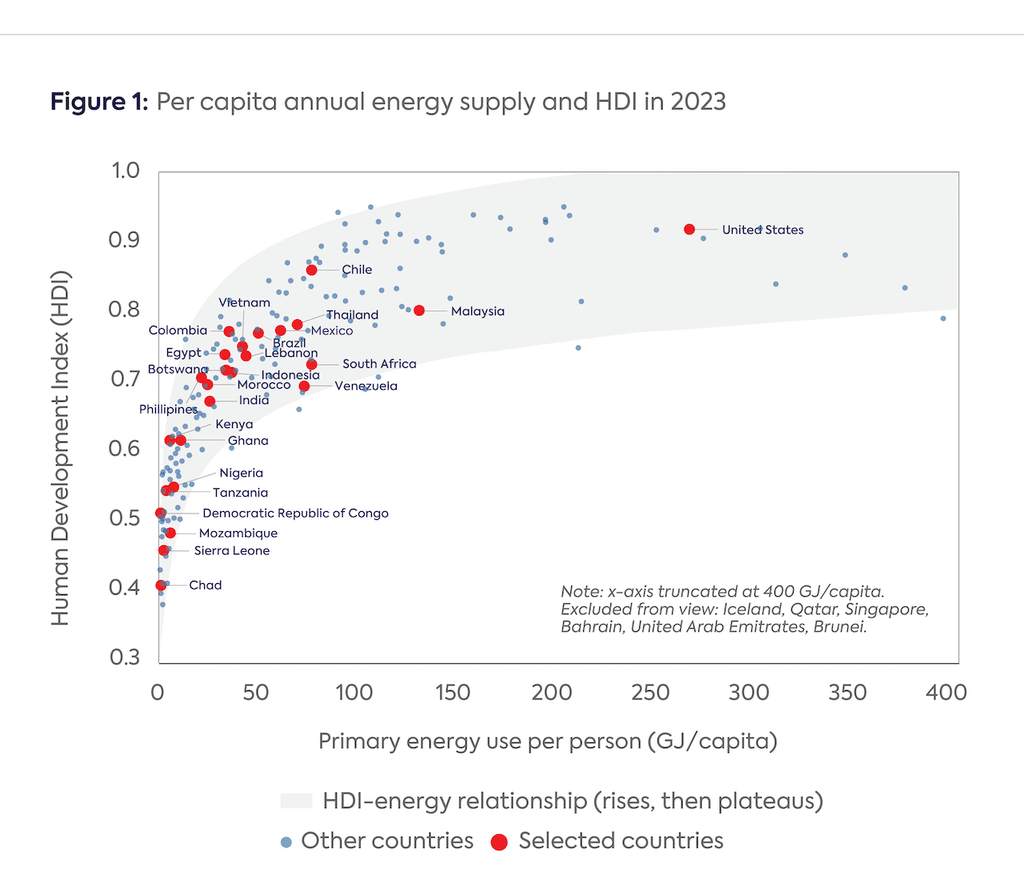
Beyond roughly 120 GJ per capita per year, the correlation between additional energy use and higher scores on the Human Development Index (HDI) weakens considerably (Figure 1); that is, more energy use is no longer strongly associated with a measurably better quality of life. These averages should be understood as reflecting historical patterns rather than fixed thresholds, although other researchers have reached similar conclusions.[xv]
Source:Inspired by a graph presented in Smil (2017), with updated data for 2023 through Our World in Data.[xvi]Visualization generated by the authors using Claude Sonnet 5 (Anthropic).
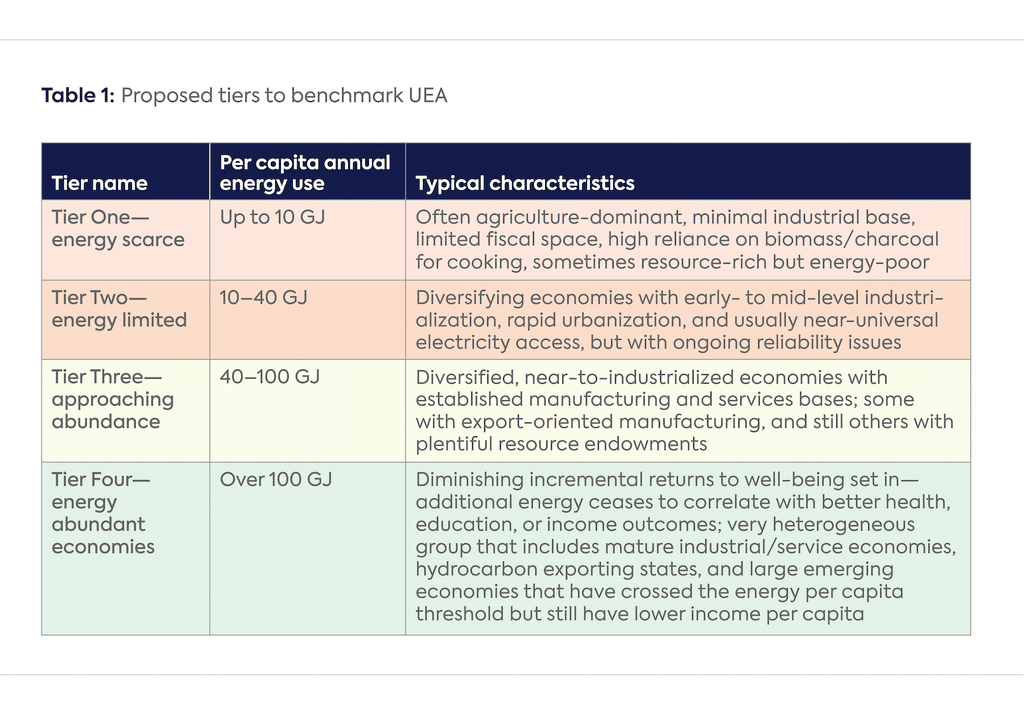
Based on these reference points, this white paper proposes an illustrative set of tiers as a basis for further discussion and research, as is presented in Table 1. The determination of tiers reflects the underlying energy statistical method employed, as discussed in the next section.
The proposed tiers can serve as a common reference for benchmarking, communicating, and measuring progress toward UEA. They can be refined through further research and analysis, however, and will need to be updated as technologies advance and energy efficiency improves. The pace of change, sequencing of interventions, technology choices, and even desirability of moving between tiers remain decisions for policymakers to make based on their country’s domestic circumstances and strategic priorities.
c. Energy Data and Statistics
The choice of energy statistics is so central to the determination of effective tiers that it merits dedicated discussion. A range of different energy statistics can be employed, and each has its strengths and weaknesses for the purpose of measuring progress toward UEA.[xvii] For example, total primary energy supply (TPES) measures the sum of the energy value of all fuels and other energy resources prior to conversion into liquid fuels or electricity and prior to translation into useful work such as transportation, heating, cooling, or illumination. Focusing on a country’s primary energy could be seen as exaggerating the extent of the country’s energy development because of the considerable share of energy that is lost as waste heat in many current energy systems, such as boilers, internal combustion engines, and furnaces.
An alternative energy statistic that could be used is total final consumption (TFC), which measures only the share of energy that reaches users, namely, the energy remaining after losses due to conversion and transmission efficiency are stripped out. A third option is total final energy consumption (TFEC), which removes from TFC figures any energy carrier that is used as a feedstock (e.g., natural gas for fertilizer production or metallurgical coal for steel production), rather than for its energy value to produce heat, pressure, electricity, or motion.
Because this white paper focuses on all the modern energy needed to drive an economy, whether used for energy purposes or feedstocks, relying on TFC would be logical. Nonetheless, as a provisional measure, this paper uses widely available TPES data because they can be correlated to historical experience, as noted above. An important area for future research and analysis would be using consumption-oriented data and developing tier demarcations appropriate to that statistical lens. This white paper does not consider traditional uses of biomass, as they do not constitute a modern form of energy.
d. Current Status
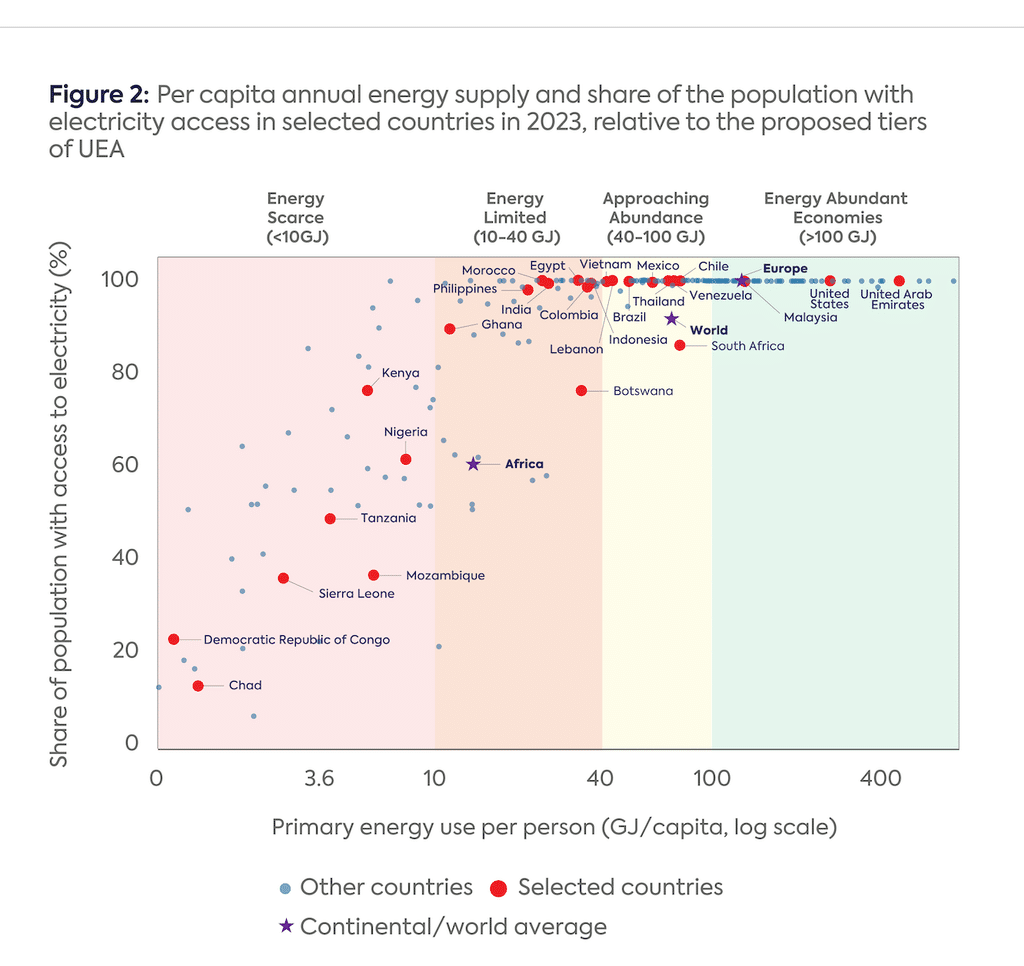
Assessing where countries currently stand relative to these tiers of energy use is instructive for understanding progress toward UEA, particularly when coupled with an assessment of the degree to which they have achieved “universality.” This means considering both national average energy use per capita per year and the extent to which energy is available to the population and broader economy. Figure 2 presents the per capita energy use (GJ; horizontal axis, log scale) for a diverse range of countries, along with continents,[xviii] plotted against the share of population with access to electricity (vertical axis). The share of the population with electricity access is used here as an imperfect proxy for the distributional dimension of a country’s energy system. The UEA tiers are shaded in the background.
The values range from Chad, where annual per capita energy use was 1.4 GJ in 2023 and less than 20 percent of the population has access to electricity, to Qatar, where energy use was more than 500 times that of Chad, at 737.6 GJ per capita. Global average per capita energy use stands at 71.6 GJ, while the average for Africa is 13.8 GJ (although the figure is far lower for sub-Saharan Africa).
Figure 2 also shows that most countries achieve universal electricity access by the time they cross Tier Two, or an annual per capita use level of 40 GJ, although several countries have managed to achieve this milestone at lower levels of energy use. Countries with higher levels of economic output, measured as gross domestic product (GDP) per capita, also tend to have higher per capita energy use, reaffirming the Energy for Growth Hub’s finding, which concerned electricity consumption, that no country has achieved high levels of economic output with low levels of energy use.
As a note of caution, Figure 2 presents only a single-year snapshot. Each country’s current position reflects a distinct history of resource endowments, industrial structure, and policy choices; countries’ energy development and systems evolve at very different speeds, as illustrated in the next section. The value of Figure 2 lies less in showing how countries arrived at their current position than in showing where the countries stand today relative to the tiers described above. Each country’s appropriate next steps will depend on its present circumstances, future needs, available technology, and financing options and priorities.
Source: Our World in Data.[xix]Visualization generated by the authors using Claude Sonnet 5 (Anthropic).
e. Past and Future Trajectories
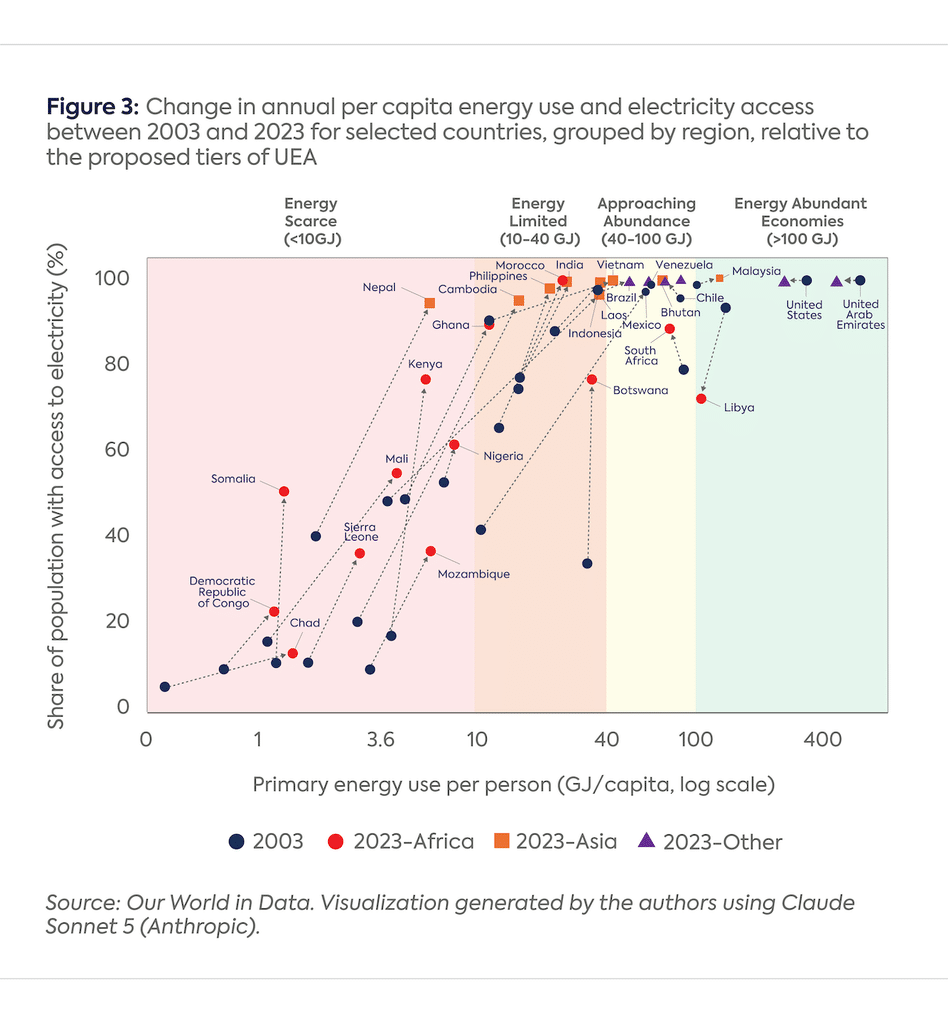
In considering how the energy sectors of LMICs may develop in the future, it is instructive to examine historical performance. Figure 3 plots per capita energy use against electricity access in 2003 and 2023 for selected countries, illustrating both significant variation in national trajectories and at least four distinct groups based on patterns of change.
The first group, which includes India, Vietnam, and Morocco, experienced major increases in per capita energy use while also reaching near-universal electricity access. Some countries in this group, including Bhutan, Cambodia, and Laos, saw per capita energy use increase largely as a result of hydropower build-out.
The second group, which includes Botswana, Kenya, and Somalia, achieved large gains in electricity access with comparatively modest growth in energy use. This reflects continued progress on last-mile connections that has not yet been accompanied by additional higher-intensity industrial and commercial activities.
The third group, comprising already energy-abundant economies such as the United States, the United Arab Emirates, and Malaysia, saw modest change, having already reached near-universal access and high consumption levels by 2003. For the United States, the United Arab Emirates, and others, annual per capita energy use actually declined slightly due to energy efficiency and structural changes, without a reduction in living standards. A fourth, smaller group—Libya and Syria—moved backward on both dimensions, a reminder that conflict and instability can erode hard-won gains.
As noted, Figure 3 depicts only selected countries and is not comprehensive. These selected countries followed distinct pathways, reinforcing the point that a country’s route toward UEA will depend on its specific context and circumstances. The multidecadal timeframe depicted in Figure 3 also illustrates a related point: Increasing per capita energy use by an order of magnitude has historically been a long-term undertaking.
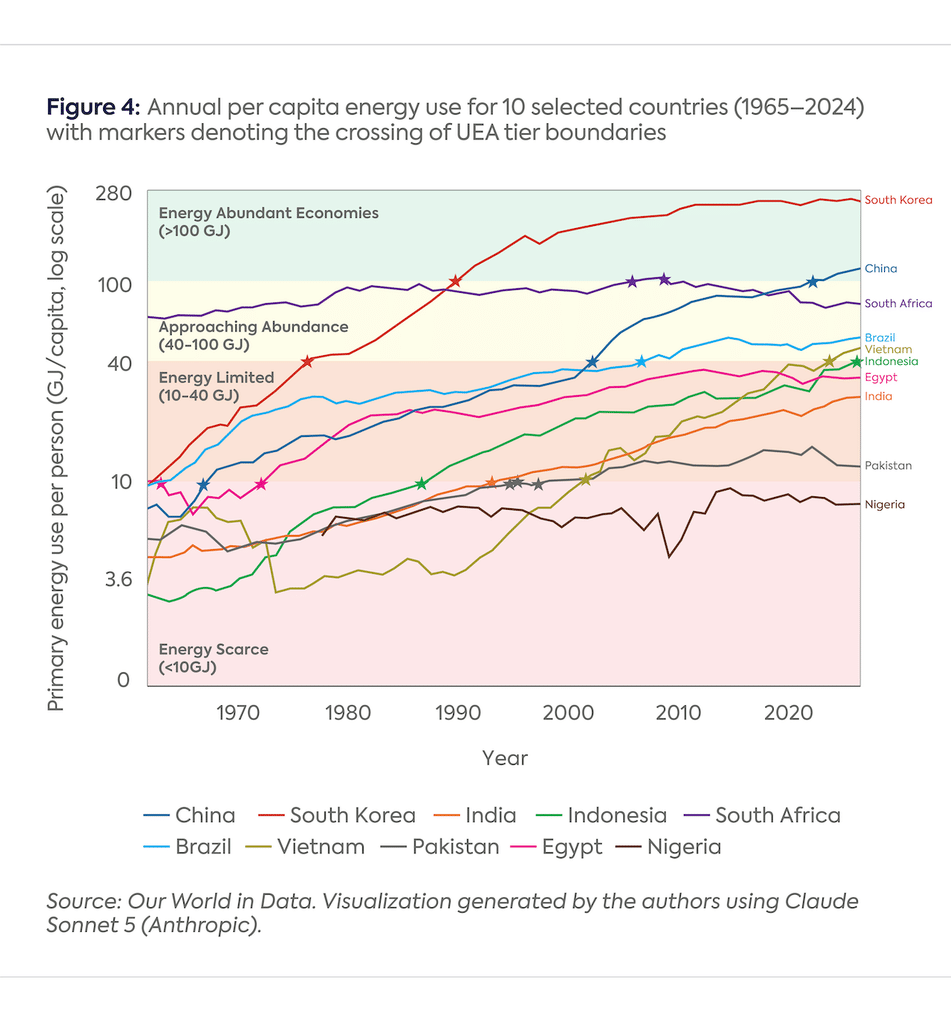
Figure 4 traces the per capita energy trajectories of 10 illustrative countries over the approximately six decades for which data are available (1965–2024). The figure shows that China took 33 years to cross Tier Two (that is, to move from 10 GJ per capita per year to 40 GJ) and an additional 18 to cross Tier Three (40 GJ to 100 GJ per capita). Vietnam similarly spent more than three decades in Tier One before crossing into Tier Two in 2001 and then more rapidly into Tier Three around 2022. South Korea crossed the two middle tiers in just 26 years—a significant transition achieved comparatively quickly.
By contrast, per capita energy use in countries such as Nigeria and South Africa has increased only modestly over the past four to five decades. Their trajectories illustrate that, while progress takes time, the passage of time does not translate into movement between tiers absent sound economic planning, institutional capacity, stable governance, and timely investments. Movement from one tier to the next also reflects the structure of the economy, the productivity of energy use, and other factors discussed in the next section.
These historical patterns are not necessarily predictive of the future. The pace at which South Korea and Vietnam industrialized reflected the technologies, financing structures, and market conditions available to them at the time. Many LMICs today have access to an expanded tool kit, including low-cost, distributed renewable energy and battery storage that can reduce reliance on large-scale grid build-out; blended finance structures and de-risking instruments to mobilize private capital faster than traditional public funding; and corridor- and compact-based planning models, such as the Mission 300 country compacts and the Lobito Corridor, that can integrate energy investments directly with anchor industrial demand. Where and how these innovations can shorten the multi-decade timelines of the past into faster progress toward UEA is a critical topic meriting further inquiry.
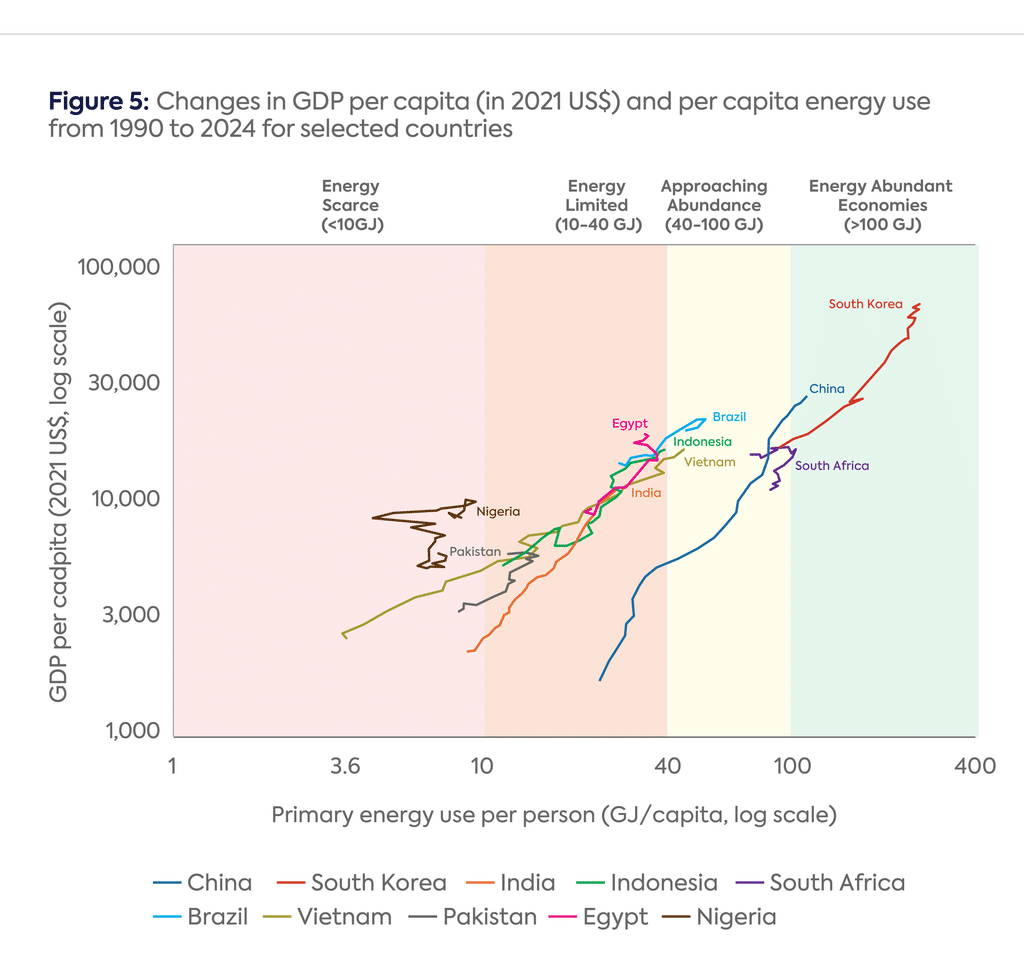
Historical energy data of the sort discussed in this section do not dictate a country’s future socioeconomic well-being. As Figure 5 illustrates, countries’ energy use and economic output followed different patterns over the past several decades. For example, Vietnam, China, and India saw steep increases in GDP per capita accompanied by proportionate increases in energy use, whereas Nigeria and South Africa saw modest increases in GDP per capita despite little appreciable growth in per capita energy use.
Source: Our World in Data.[xx]Visualization generated by the authors using Claude Sonnet 5 (Anthropic).
f. Supporting Dashboard
Per capita energy use can serve as the headline indicator for progress toward UEA because it is simple to measure and communicate. Nonetheless, per capita figures by themselves reveal little about whether energy use is translating into job creation, income growth, and broader socioeconomic development. Relying on the headline number alone therefore risks equating higher energy use with progress, regardless of how that energy is used or who benefits from it.
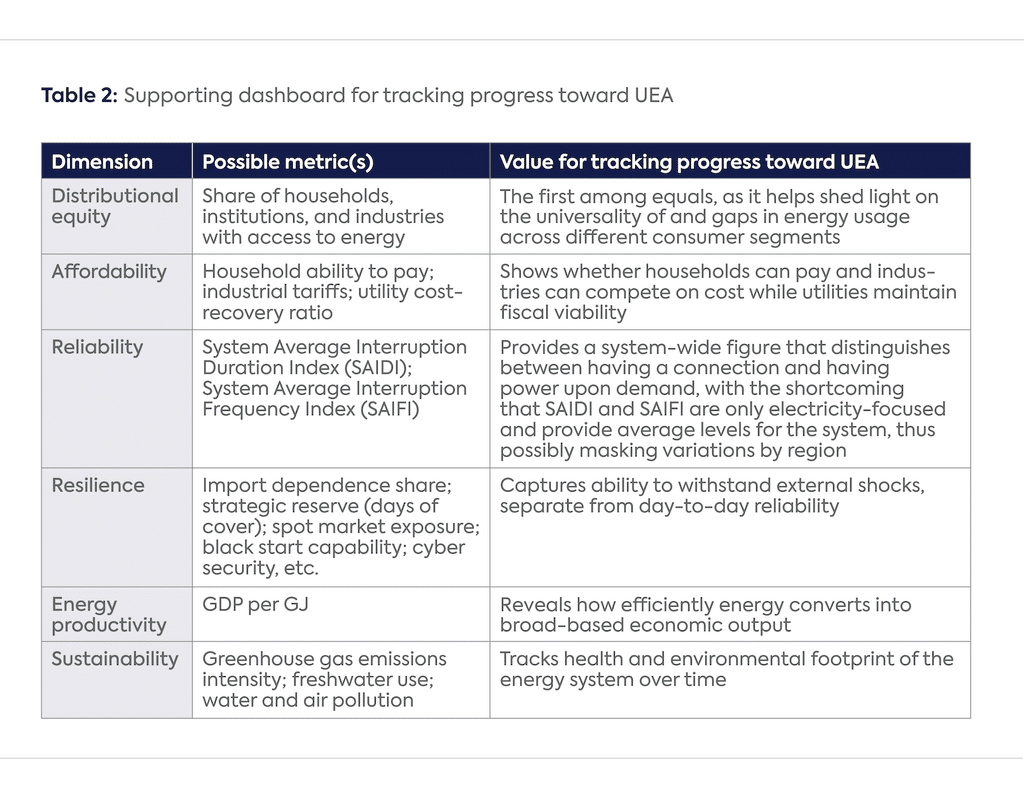
For this reason, it is important to accompany the headline metric with other metrics that collectively form a dashboard, each offering distinct insights. Table 2 and the section below introduce a short list of additional dimensions not captured by the headline metric and identify additional metrics that can help assess them. This discussion does not propose specific metrics for every dimension, as further debate and careful assessment of data availability and reliability are needed.
Distributional equity: The goal of UEA is not to pursue the availability or consumption of energy for its own sake but to pursue it within a framework that promotes widespread benefits from reliable and affordable energy for the entire society. For this reason, the first metric to complement per capita annual energy use should be one that conveys the extent of progress toward universality. Beyond the household level, data on the adequacy of energy for other consumer sectors are not consistently available, and even less is known about latent demand that could materialize with adequate availability of energy. A widely available proxy that can help fill this gap is the share of a country’s population with access to electricity.[xxi] Figures 3 and 4 therefore plot annual per capita national energy use against national electricity access rates.
Affordability: The term “affordability” captures whether the price of energy is within reach for households, service institutions, commercial establishments, and industries, including industries that a country hopes to attract. Tracking households’ ability to pay—for example, by measuring the share of household income spent on electricity, cooking, and transport needs—is necessary, as abundant energy supply is of limited value if it remains too expensive for most citizens.[xxii] A country could also report strong per capita consumption driven by a small number of energy-intensive users while ordinary households and small businesses lack the ability to pay for their energy bills. On the other hand, high prices for industrial energy relative to prices in other geographies can reduce the competitiveness of, and therefore jeopardize, existing and potential facilities.
Energy prices in many countries are deeply political and therefore subsidized or cross-subsidized in ways that can obscure the true cost of supply. Affordability considerations can also affect utility finances. Tariffs that are set too low can undermine cost recovery for utilities, setting in motion a vicious cycle: The utility lacks the revenue needed to invest in the maintenance and expansion that supports reliability; more well-to-do consumers rely on diesel generators or rooftop solar systems; and utility revenues drop further.[xxiii] This dynamic creates a tension between near-term affordability and longer-term supply quality that policymakers and energy regulators may need to manage.[xxiv]
Reliability: The term “reliability” describes whether energy systems are available when needed. It applies to all parts of a country’s energy system—to fuels as well as the power system. For the electricity sector, two commonly used indicators of reliability are the System Average Interruption Duration Index (SAIDI), which measures the duration of power supply interruptions, and the accompanying System Average Interruption Frequency Index (SAIFI), which measures how often interruptions occur. A country can report high rates of electricity access while its farms, industries, and institutions continue to suffer from chronically unreliable supply.
Reliability is a major consideration for investors in industrial facilities seeking to evaluate whether a market can support energy-intensive operations without requiring costly on-site backup generation. There is, however, a practical limitation to measuring power sector reliability. Many utilities in emerging markets lack the metering and data systems needed to calculate SAIDI and SAIFI with confidence and consistency. In the few countries that have seen increased deployment of decentralized electricity infrastructure, regulations for timely reporting of system reliability remain in the early stages. This means that independent audits, wider smart-meter deployment, or other targeted investments in grid monitoring and remote sensing technologies may be a prerequisite for meaningful tracking.
Resilience: The term “resilience” refers to the ability of a country’s energy systems to guard against and, if needed, recover from shocks such as external price spikes, supply disruptions, technical failures, and malicious attacks. At a time when energy systems increasingly rely on digital controls and face growing risks of climate change–related infrastructure damage, it is critical that they be hardened. Consideration of resilience is also timely in light of recent disruptions to global shipping routes for crude oil, liquefied natural gas (LNG), and related commodities, which have posed significant challenges for lower-income, import-dependent economies. Countries that import a high share of their energy needs[xxv] and/or hold limited strategic reserves can face sudden and severe economic strain when global supply chains are disrupted. Distinguishing between short- and long-term risk exposure is important, as a country can have relatively low nominal import dependence but still face high exposure to spot-market volatility during a crisis (as Pakistan and Bangladesh did in the early stages of both Russia’s war in Ukraine, when they were priced out of the market for LNG, and the Iran war, when physical LNG deliveries were disrupted). In some cases, weaknesses in domestic supply chains and logistics or a lack of emergency preparedness may contribute as much to reliability problems as import dependence itself.
Energy productivity: Typically measured as GDP per GJ, productivity indicates how efficiently a country converts each unit of energy into economic output. The same quantity of energy can generate different levels of useful economic output—and thus have divergent effects on a country’s socioeconomic advancement—depending on how it is used and how it is distributed across industrial, commercial, and residential activity. A heavily extractive economy, for example, can have comparatively high per capita energy consumption even while residential access and energy use remain comparatively low (as illustrated by Botswana’s 2003 position in Figure 3). Nor does high consumption necessarily translate into broad-based domestic job creation in downstream value chains. Energy productivity is also closely related to the structural composition of a country’s economy. Shifts in an economy’s composition, such as a move toward services, can reduce energy intensity without any underlying improvement in energy efficiency. Productivity figures are therefore best interpreted alongside a country’s broader economic structure rather than in isolation.
Sustainability: Sustainability metrics track indicators such as the intensity of greenhouse gas emissions per unit of economic output, freshwater consumption, water pollution, and local air pollution from the energy sector. They help countries evaluate the health and environmental impacts of their energy system over time. Some LMICs prioritize sustainability metrics, whereas others place greater emphasis on the sufficiency and quality of energy supply (as discussed in greater detail below).
4. Opportunities and Challenges in the Pursuit of UEA
Successfully pursuing UEA will bring opportunities but will also necessitate managing challenges and tensions among different policy priorities. This section discusses several such opportunities and challenges.
Identifying the right approach for each country or region: UEA is a powerful policy goal, but one that is qualitative rather than a rigidly defined state of existence. Its particular form will vary across countries and over time, reflecting the range of factors discussed previously. Processes of urbanization and densification will have significant implications for pursuing UEA. The role of decentralized energy systems in complementing or strengthening centralized infrastructure to deliver UEA will also vary across and even within countries. Uniformity of conditions is not to be expected. For this reason, a core challenge for any country seeking UEA is to employ an approach suited to its current and emerging reality.
Effective planning: Delivering UEA will require effective planning at many levels of society. Energy system planners will need realistic outlooks for demand to inform decisions about energy system requirements: How much new electricity generation, whether centralized or distributed, will be needed as new industries and businesses grow? How much new transmission or distribution capacity needs to be added, and where? Will electric mobility play a significant role in the transportation system? If so, how quickly and in which regions? How much liquid fuel will be required for conventionally fueled vehicles? What volume of energy demand will arise in growing urban areas, and what forms of energy will they require? Constructing excessive or premature energy supply risks creating capacity that lacks an economic rationale—and society pays for that capacity in one form or another.
In addition, planning activities cannot take the form of a one-way process that simply translates anticipated future energy demand into new supply. They must also account for the factors that will affect the new supply’s timing and cost, including the availability of capital on viable terms; critical technological and other inputs; road, rail, and port infrastructure; a properly sized and trained workforce; and institutional capacity and legal and regulatory frameworks.
Effective planning is challenging for any society: It requires accuracy and flexibility rather than rigid or politically dictated assumptions. In a fragmented world, where a relatively stable global trade environment has given way to more unpredictable tariff regimes, planning is even more difficult. Nonetheless, if done well, it can yield significant benefits for society by enabling the expedited investment and growth that UEA promises.
Factoring in sustainability: Another challenging dimension concerns sustainability, particularly in relation to climate change. As noted previously, successfully pursuing UEA requires each country to identify its socioeconomic objectives and translate them into plans to develop its energy systems and deliver energy services reliably and affordably to households, industries, agriculture, commerce, and services. The effort cannot succeed without alignment between these objectives and the pathway to UEA.
In the short term, it is possible, and even likely, that some LMICs may prioritize affordability and reliability over sustainability. Energy resource choices are, after all, a matter for sovereign decision-making. Political accountability plays an important part in this reality: In almost all countries, the inability of political leaders to meet the energy requirements of their society—the failure to “keep the lights on”—results in popular discontent. In participatory democratic systems, this can translate into elected officials getting voted out of office. In authoritarian settings, it can translate into severe political unrest and instability.[xxvi]
This does not mean that LMICs will or should disregard sustainability and low- or zero-emissions technologies as they pursue UEA. Indeed, reliance on imported conventional fuels entails exposure to volatile global fuel markets, which may pose risks that political leaders would be happy to avoid. Conventional energy systems also contribute to local air pollution and water scarcity. In addition, many decision-makers in LMICs understand that poorer countries and subnational regions face the greatest vulnerability to the impacts of climate change. Climate-driven severe weather events, heatwaves, and altered precipitation patterns will bring significant harm to the countries and regions least able to prepare for and protect themselves from these impacts.
That said, zero-emission energy systems can present complexities of their own, particularly in geographies where they have not previously been deployed. Energy decision-makers will need to engineer financial packages that can support zero-emission infrastructure with high initial capital costs, even though such infrastructure is often less expensive to operate over its full lifetime than conventionally fueled systems. This capital intensity may be especially challenging at a time when many LMICs are struggling to manage high debt burdens and face significantly higher costs of capital than advanced economies.[xxvii] In addition, the workforce needed to operate zero-emission energy systems may be in short supply, and some zero-emission systems, such as utility-scale wind and solar energy installations, require integration into existing grids, which is challenging in any setting because of the need to balance real-time supply and demand changes with variable generation from sources such as wind and solar energy.
The challenges discussed here can be managed successfully if decision-makers make doing so a priority and relevant partners provide support where needed. At the same time, many clean energy technologies are increasingly becoming more cost-competitive, and in some cases even cost-superior, strengthening their economic attractiveness in many settings.[xxviii] Thus, opportunities for win-win solutions exist for the LMICs prepared to pursue them.
5. Conclusion
Universal energy abundance, a state of development in which supplies of reliable and affordable energy meet the full range of a country’s needs and facilitate greater socioeconomic opportunity and well-being, builds on the vital work that has been done to expand energy access in LMICs. But UEA aims to address more than the energy requirements of households, small businesses, clinics, and other last-mile consumers: It seeks to deliver reliable, affordable energy that can enable new widespread socioeconomic opportunities.
This white paper has sought to pose a series of critical questions that require ongoing deliberation among stakeholders interested in advancing UEA: What does UEA look like in concrete terms? How can progress be tracked? And what interventions would be needed to meaningfully change the pace of historical energy system development—which, for many LMICs, has been slow relative to their needs?
Achieving UEA will take time. The definitions, tiers, and metrics discussed in this paper are meant to contribute to an emerging, wider discussion about how LMIC decision-makers can conceptualize, measure, and pursue UEA, rather than to provide any final answers. Much more work remains to identify the optimal metrics that can complement the headline data on GJ per capita per year; the technological and financial factors that can facilitate progress; and the policy interventions to accelerate the achievement of UEA. Ultimately, whether energy system development in LMICs continues at its current pace or accelerates to meet the thresholds of UEA will depend on choices made by national governments, investors, and development partners in the years ahead.
Notes
[i] For purposes of this discussion, the term “low- and middle-income countries” refers to what the World Bank categorizes as low-income, lower-middle-income, and upper-middle-income countries, with the exception of China. China’s size, scale, and other attributes place it in its own category. For the World Bank’s income classifications, see World Bank, “World Bank Country and Lending Groups” (for fiscal year 2027), accessed August 8, 2026, https://datahelpdesk.worldbank.org/knowledgebase/articles/906519-world-bank-country-and-lending-groups.
[ii] In practice, work on energy access has expanded beyond households to include public services and small-scale productive economic activities, such as mechanical power for agriculture, textiles, and other industries. For a detailed note on the International Energy Agency’s (IEA’s) methodology for defining energy access, see IEA, “Defining Energy Access: 2020 Methodology,” 2020, https://www.iea.org/articles/defining-energy-access-2020-methodology.
[iii] In many countries, urban households and commercial establishments have also gained improved energy services as a co-benefit of investments in grid-expansion programs.
[iv] For the precise terms used to express the goal of SDG 7, and for a report on progress to date, see IEA, International Renewable Energy Agency (IRENA), United Nations Statistics Division (UNSD), World Bank, et al., “Tracking SDG 7: The Energy Progress Report,” 2026, https://www.iea.org/reports/tracking-sdg7-the-energy-progress-report-2026.
[vi] The MTF, developed by the World Bank’s Energy Sector Management Assistance Program (ESMAP), employs a six-tier system that evaluates electricity and cooking services based on attributes including capacity, reliability, affordability, and safety. See ESMAP, “The Multi-Tier Framework for Energy Access: Insights and Impact from a Decade of Surveys,” World Bank, March 31, 2026, https://www.esmap.org/publications/multi-tier-framework-energy-access-insights-and-impact-decade-surveys.
[vii] For context, in 2023, average annual per capita electric power consumption was 12,551 kWh in the United States, 6,523 kWh in China, and 5,734 kWh in the European Union. The per person definition refers to the IEA’s assumption of “a minimum level of consumption of 250 kilowatt-hours (kWh) per year for a rural household and 500 kWh for an urban household”. IEA, “Defining Energy Access: 2020 Methodology,” 2020, https://www.iea.org/articles/defining-energy-access-2020-methodology.
[ix] Many tracking frameworks for energy access focus on electricity access levels. Data also exist on access to cleaner cooking systems. When speaking about energy access, the present discussion focuses on electricity access data to avoid issues that complicate the understanding of clean cooking, such as “fuel stacking”—the use of multiple cooking systems. For an example of a tracking framework oriented toward electricity access, see a recent report on Mission 300, a collaboration between the World Bank and the African Development Bank that seeks to connect 300 million people in sub-Saharan Africa to electricity by 2030: https://www.worldbank.org/ext/en/energizingafrica/progress-portal, accessed August 8, 2026.
[xi] This discussion of UEA is distinct from debates about “energy abundance” that are currently circulating in US politics. Senior representatives of the current US administration advocate for “energy abundance” (sometimes used interchangeably with the term “energy dominance”) as a status delivered predominantly by expanded fossil fuel usage, aided by extensive deregulation. By contrast, the left-of-center commentators Ezra Klein and Derek Thompson argued in a recent book for a different version of “energy abundance,” in which the United States would accelerate its construction of clean energy (and housing), facilitated by revised permitting and siting decisions. The present discussion of UEA focuses instead on the need for reliable and affordable energy at scale, especially in LMICs. Ezra Klein and Derek Thompson, Abundance (Avid Reader Press, 2025).
[xii] Most existing energy-access metrics, including the MTF and the MEM, are expressed in kWh, a unit typically used to measure electricity consumption. Because these frameworks only measure electricity, they capture a narrower slice of total energy use than a GJ-based measure. This white paper uses GJ per capita per year because that metric emphasizes that the entire energy economy must be considered, although one can translate GJ into an equivalent number of kWh, as noted in the text. In addition, this discussion addresses modern energy systems, which exclude traditional biomass usage.
[xiii] Vaclav Smil, Energy and Civilization: A History (MIT Press, 2017), 358–63.
[xiv] For reference, the MEM advocates for a floor of 1,000 kWh per capita of electricity consumption. That figure, which includes only electricity, equates to 3.6 GJ per capita, which is less than what has been required historically to meet basic subsistence.
[xv] One study linking energy consumption to human well-being in different countries suggests that most basic developmental needs, such as access to electricity, basic sanitation, infant mortality, and life expectancy, can be achieved at an energy consumption level of less than 50 GJ per capita. Other benefits such as per capita food supply, prosperity, and air quality were observed to peak at energy consumption levels of 70 to 125 GJ per capita. Jackson, R. B., Ahlström, A., Hugelius, G., Wang, C., et al., “Human Well-Being and Per Capita Energy Use,” Ecosphere 13, no. 4 (2022): e3978. Other work on Decent Living Standards, which focuses on health, shelter, nutrition, socialization, and mobility, estimates that 9 to 36 GJ per capita is required to meet those basic needs, with variations attributed to differences in the needs and lifestyles of different countries. These findings highlight that the precise energy thresholds at which different countries meet their stated development needs can vary substantially from place to place and over time. Kikstra, J. S., Mastrucci, A., Min, J., Riahi, K., et al., “Decent Living Gaps and Energy Needs Around the World,” Environmental Research Letters 16, no. 9 (2021): 095006.
[xvi] “Data Page: Total Energy Supply Per Capita,” part of the following publication: Hannah Ritchie, Pablo Rosado, and Max Roser, “Energy,” 2023. Data adapted from Energy Institute (EI), Smil, US Energy Information Administration (EIA), Various sources. https://archive.ourworldindata.org/20260814-181947/grapher/energy-mix.html [online resource] (archived August 14, 2026); “Data Page: Human Development Index,” Our World in Data (2026). Data adapted from the United Nations Development Programme, Human Development Report. Retrieved from https://archive.ourworldindata.org/20260727-165533/grapher/human-development-index.html [online resource] (archived July 27, 2026).
[xvii] For a discussion of different energy statistics schemes, see IEA, “Where Does the World Get Its Energy?” accessed July 19, 2026, https://www.iea.org/world/energy-mix.
[xviii] GJ per capita figures presented in this paper exclude the use of traditional biomass.
[xx] GDP per capita data from Our World in Data. “Data Page: GDP per Capita,” part of the following publication: Max Roser, Bertha Rohenkohl, Pablo Arriagada, Joe Hasell, et al., “Economic Growth,” 2023. Data adapted from Eurostat, the Organisation for Economic Co-operation and Development, the International Monetary Fund, and World Bank. https://archive.ourworldindata.org/20260518-093348/grapher/gdp-per-capita-worldbank.html.
[xxi] As noted previously, metrics that treat “access” as a binary condition and that fail to consider other dimensions are of limited utility as a standalone metric. Nonetheless, they remain an important part of measuring UEA. While it would be more ideal to use the MTF because it measures the quality of electricity access, MTF surveys have been completed in only 27 countries over the past decade due to their time and resource intensity, making it challenging to use the framework for global comparisons. Beyond electricity access, another useful proxy is the share of the population with access to clean cooking, although the lack of precise country-level data on energy use by stove type and the use of secondary fuel sources (“fuel stacking”) makes this a more challenging measure. This white paper recommends the share of electricity access because it is more closely associated with economic activity outside the home. On measurement issues, see IEA, “Defining Energy Access: 2020 Methodology,” 2020, https://www.iea.org/articles/defining-energy-access-2020-methodology.
[xxii] Affordability can be challenging to achieve even in energy-abundant economies. For example, one-third of all households in the United States experienced some form of energy insecurity in 2024, finding it increasingly difficult to pay their monthly energy bills. For more, see Hernández, D., “Energy Insecurity in the United States: Trends, Disparities, and a Widening Crisis: 2024 RECS Update,” Center on Global Energy Policy at Columbia SIPA, April 29, 2026, https://www.energypolicy.columbia.edu/publications/energy-insecurity-in-the-united-states-trends-disparities-and-a-widening-crisis-2024-recs-update/.
[xxiii] The same logic applies to other energy products, such as diesel and gasoline.
[xxiv] Making matters more complex is the fact that the relationship between the affordability and sufficiency of energy services runs in two directions. A household’s ability to pay for energy services can increase if members of the household achieve higher income levels. Those higher income levels—often a reflection of additional opportunities such as new jobs or higher wages—are themselves partly enabled by the availability of reliable and affordable energy.
[xxv] This can mean imports of electricity, fuels for electricity generation, fuels for industrial feedstock, and/or technologies in the energy supply chain, such as turbines or batteries.
[xxvi] In recent years, many multilateral development banks (MDBs) and development finance institutions have declined to support new upstream fossil fuel projects, except in the least-developed economies. This has been perceived by many people in LMICs as coercive, given the prominent role that fossil fuels have played and continue to play in advanced economies, and at cross-purposes to development goals. The World Bank has been reconsidering its 2017 ban on upstream natural gas projects. For an example of the arguments in favor of reform in MDB lending for upstream oil and gas in LMICs, see African Energy Chamber, “AEC: It’s Time for the World Bank to End the Ban on Upstream Financing and Tackle Africa’s Energy Poverty Crisis,” June 16, 2025, accessed August 3, 2026, https://energychamber.org/aec-its-time-for-the-world-bank-to-end-the-ban-on-upstream-financing-and-tackle-africas-energy-poverty-crisis/.
[xxviii] Cost reductions in many clean energy–generating technologies have been a dramatic and protracted trend, especially in solar photovoltaic systems, electrochemical batteries, and to a somewhat lesser extent wind energy. But cost reductions are not inevitable, and costs are not uniform from one country to the next. The most recent edition of the annual analysis of the levelized cost of energy by Lazard, which focuses on the US market, although it is frequently cited in the global energy industry, found cost increases for some clean energy systems in the past year. Some of these increases reflect developments specific to the US market, such as tariff increases. Others reflected more general developments, such as input costs. See Lazard, “Levelized Cost of Energy,” July 2026, https://www.lazard.com/media/kcfconhf/lazards-lcoeplus_vf.pdf.