This website uses cookies as well as similar tools and technologies to understand visitors’ experiences. By continuing to use this website, you consent to Columbia University’s usage of cookies and similar technologies, in accordance with the Columbia University Website Cookie Notice.
The Center on Global Energy Policy (CGEP) at Columbia University SIPA today released a new report examining Project-based Carbon Credit Markets (PCCMs) in G20 countries and Singapore. A...
Announcement• June 17, 2026
Energy Explained
Get the latest as our experts share their insights on global energy policy.
The 109-day-old Iran crisis is heading toward an off-ramp in the form of a not-yet-public Memorandum of Understanding to reopen the Strait of Hormuz. While energy markets are...
This event will take place in-person in Washington DC, at the Rayburn House Office Building, Room 2168 (Gold Room). Advance registration is required. Announcing New Columbia University Publications...
We are the premier hub and policy institution for global energy thought leadership. Energy impacts every element of our lives, and our trusted fact-based research informs the decisions that affect all of us.
This commentary represents the research and views of the author. It does not necessarily represent the views of the Center on Global Energy Policy. The piece may be subject to further revision. Contributions to SIPA for the benefit of CGEP are general use gifts, which gives the Center discretion in how it allocates these funds. More information is available at Our Partners. Rare cases of sponsored projects are clearly indicated.
One of the enduring mysteries of the European gas market landscape has been the relative lack of recovery in industrial gas use following the 2022 global energy crisis, despite a steep drop in gas spot prices in 2023 from the previous year’s records.
After the crisis hit, the demand side was crucial to the adjustment by the EU (which also benefited from warmer-than-average weather). In 2022, EU gas consumption dropped by 13.5% compared to the prior year’s levels,[i] providing more than 50 billion cubic meters (bcm) of relief in an extremely tight European and global gas market. Price-responsive demand in the EU’s industrial sector accounted for approximately 45% of this demand decrease, with most of the rest coming from the buildings sector.[ii]
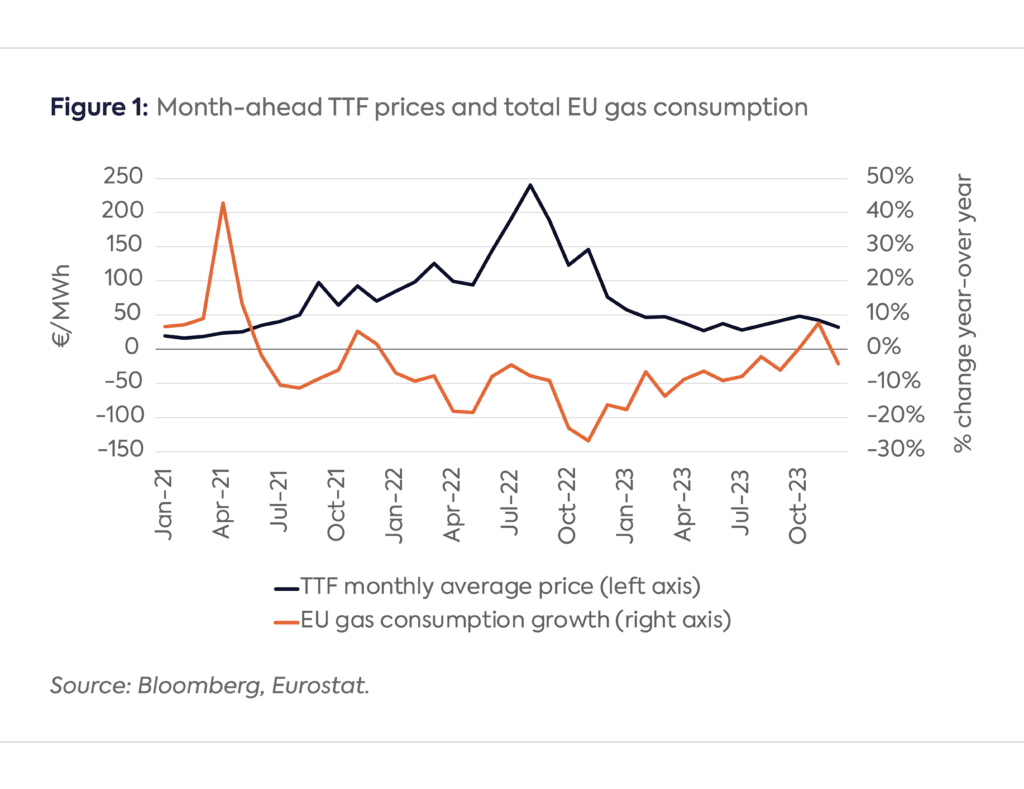
Price pressures have started to abate since late 2022. The benchmark month-ahead TTF price dropped by 70% from 2022 levels to an average of €40 per megawatt hour (MWh) (or $13 per million British thermal units [MMBtu]) in 2023. TTF prices slid further so far this year, averaging €30/MWh in January 2024 and €25/MWh in February. EU gas demand continued to slide, however, registering a 7% decline in 2023 from 2022 levels (Figure 1).
This raises the crucial questions of how much of the 2022–23 demand drop is structural and whether some of the lost industrial gas demand will return in the medium term. The stakes are high for citizens and policymakers alike, as this industrial gas demand drop has not resulted in significant fuel switching, which can be reversed when prices return to normal levels, but rather in lower industrial output, notably due to the loss of competitiveness. Permanent deindustrialization in the EU would impact millions of jobs and trillions of euros worth of capital stock in the manufacturing sector. This commentary analyzes the present state of EU industrial gas consumption and explores the potential causes for ongoing weakness in demand.
Understanding EU Industrial Gas Demand
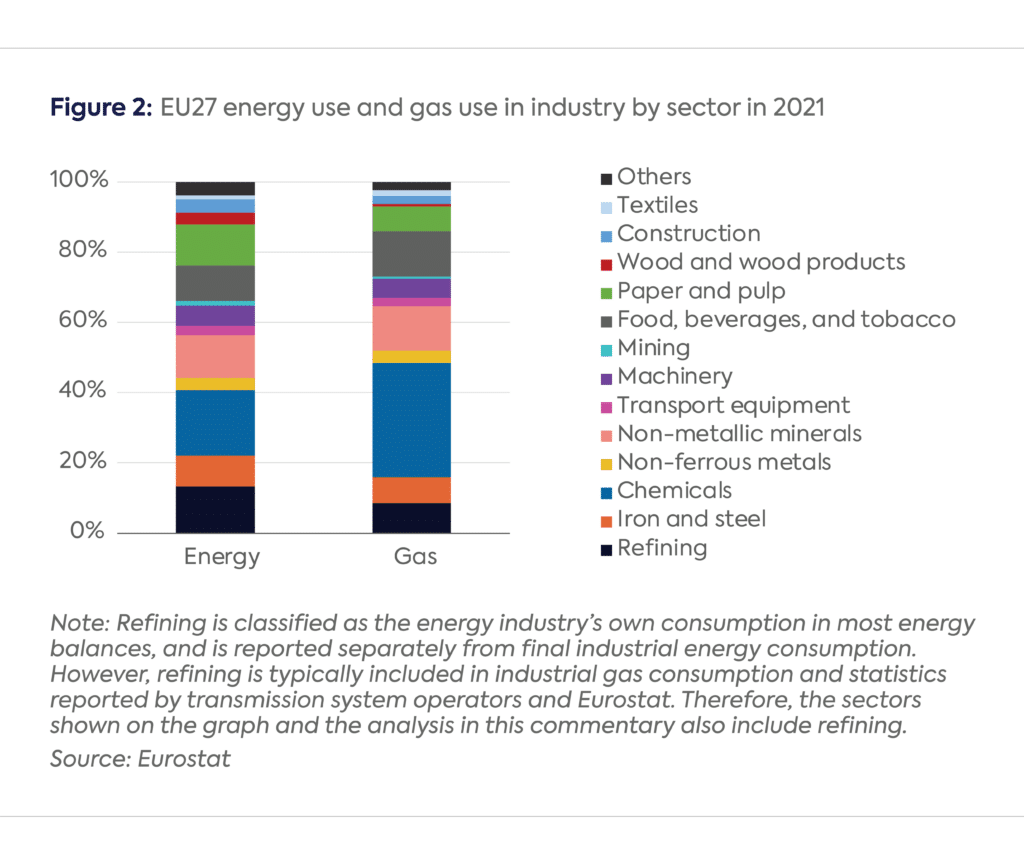
Industries use gas either for power and heat generation or as a raw material, especially for nitrogen-based fertilizer production. EU industrial gas use is concentrated in only a handful of sectors: chemical and petrochemical production (32%); non-metallic minerals, which includes cement, glass, and ceramics manufacturers (13%); and the food and beverage industry (13%). While the percentages are different, these sectors—and particularly the chemical and petrochemical industry, which is especially gas-dependent—are also among the largest users of energy at the EU level. Other significant gas-consuming sectors include refining (8%), iron and steel production (7%), and paper and pulp manufacturing (7%) (Figure 2).
Persistently Weak Industrial Gas Consumption despite Lower Prices
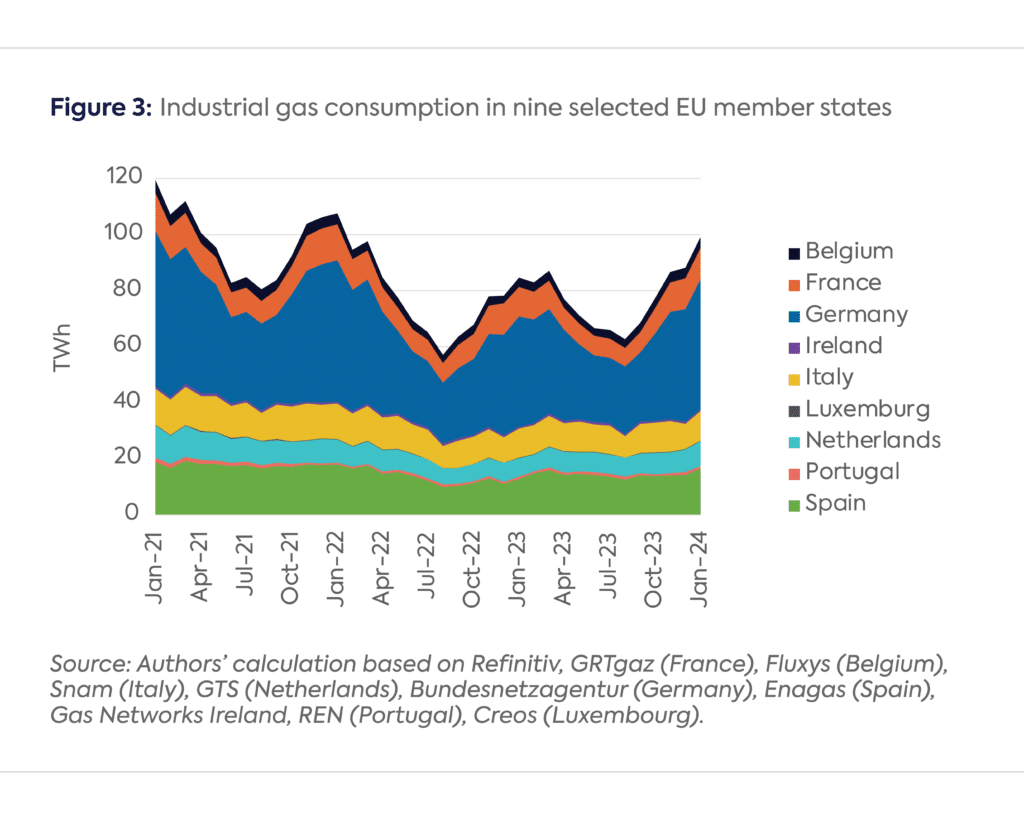
Industrial gas use, which was the most responsive to high prices in 2022, remained weak in 2023, despite the moderation of prices. In nine EU economies (representing around 75% of EU industrial gas demand) where industrial gas consumption is either separately reported by transmission system operators (TSOs) or reasonable estimates can be made to disaggregate industry from a broader category of non-distribution-related demand,[iii] industrial gas use was 12% lower in the first half of 2023 (H1 2023) than during H1 2022, and 24% lower than during H1 2021 (Figure 3). Although industrial demand was up by almost 10% year-over-year during H2 2023, this uptick was largely due to the low basis in H2 2022, which coincided with the worst period of the 2022 energy crisis. When compared with pre-crisis levels, industrial gas use was still 21% lower in 2023 than in 2021. Germany, the largest industrial gas user in the EU, experienced a 24% drop between 2021 and 2023.
The rebound, which began in H2 2023, has continued in early 2024, with industrial gas demand in the nine EU countries up by 17% year-over-year in January. However, this recovery is only partial relative to pre-crisis levels; industrial gas use in January 2024 was still 17% lower than in January 2021.
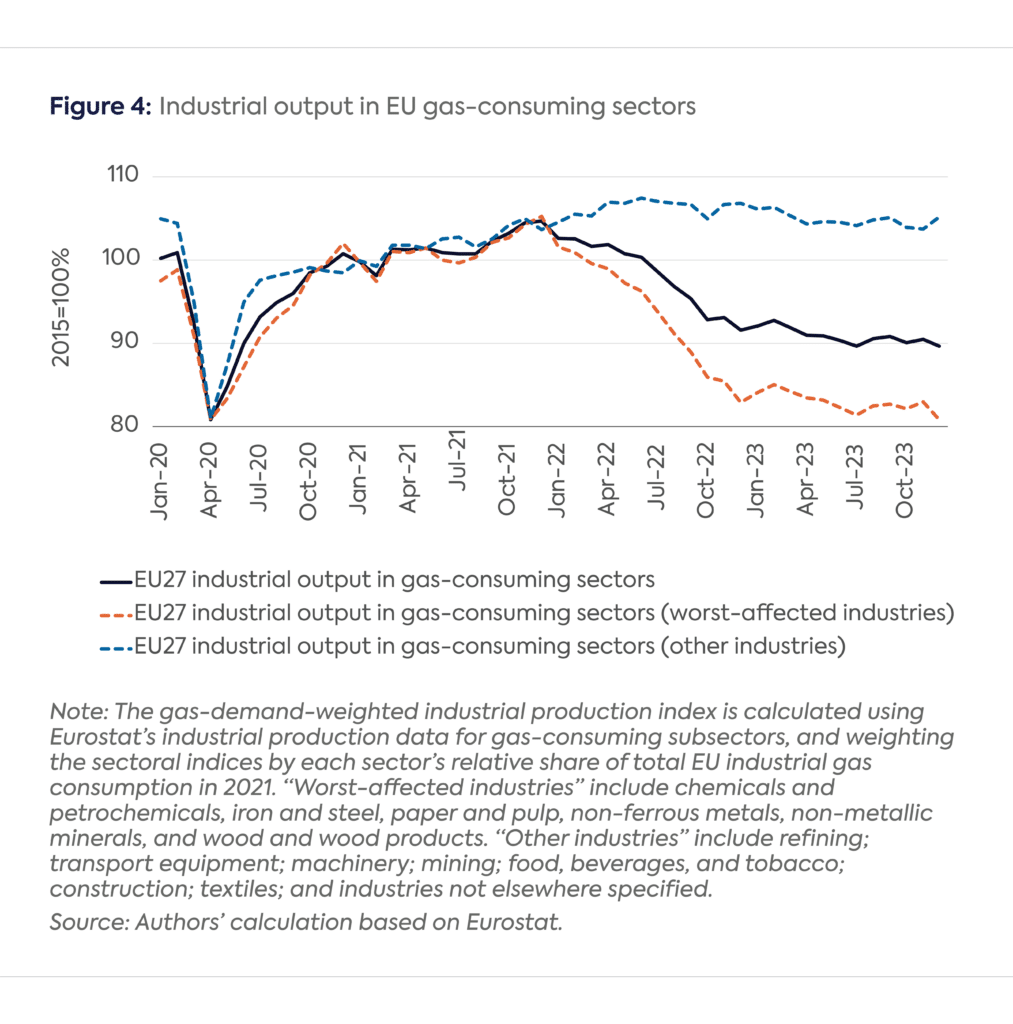
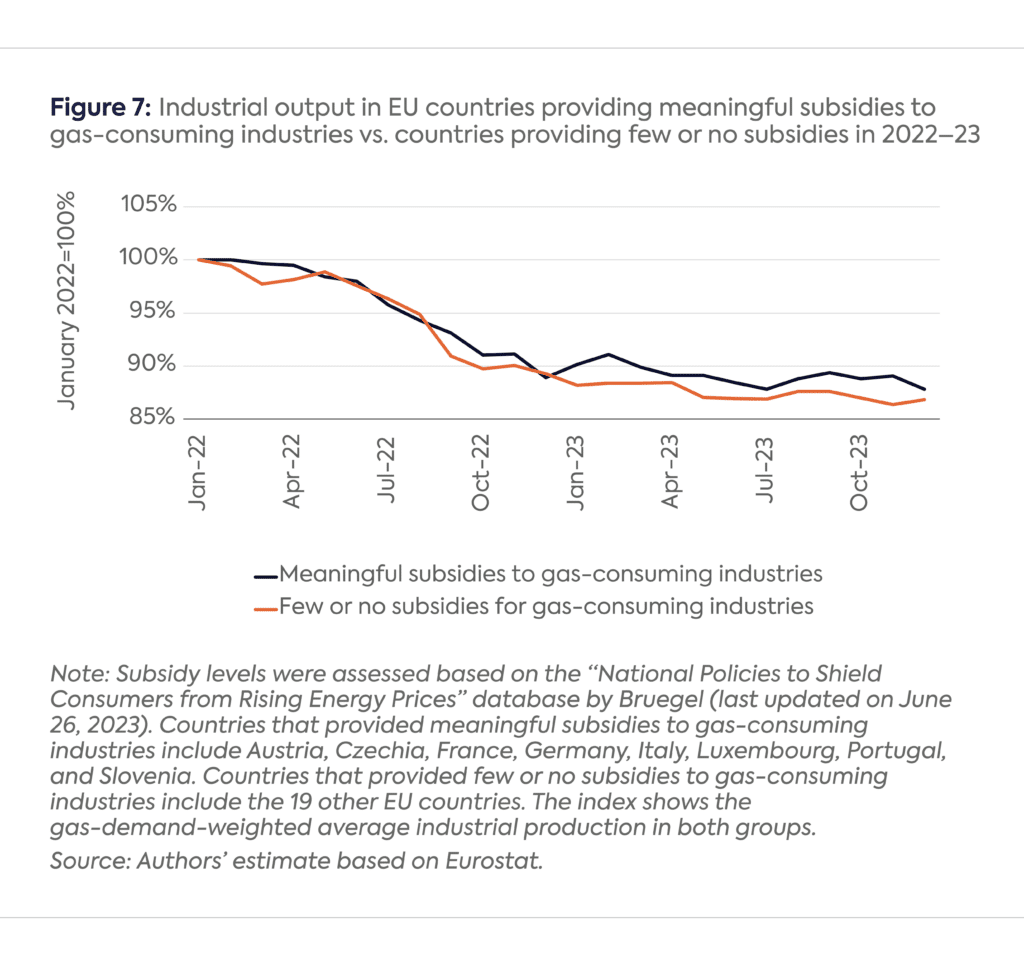
The EU’s gas-demand-weighted industrial production index declined by about 11 percentage points between January and December 2022, and remained depressed throughout 2023, ending the year approximately 13 percentage points below January 2022 levels. The average decline of this index masks a large difference between a number of mostly energy-intensive sectors that were heavily impacted by high gas and electricity prices in 2022 and some other gas-consuming sectors that were hardly impacted at all. The worst-affected gas-consuming sectors’ aggregate output declined by 19 percentage points from January to December 2022, and slid by another 2 percentage points through the end of 2023. Meanwhile, the less-affected gas-consuming industries saw a broadly flat production profile throughout the energy crisis and their demand-weighted output in December 2023 was practically unchanged from January 2022 levels (Figure 4).
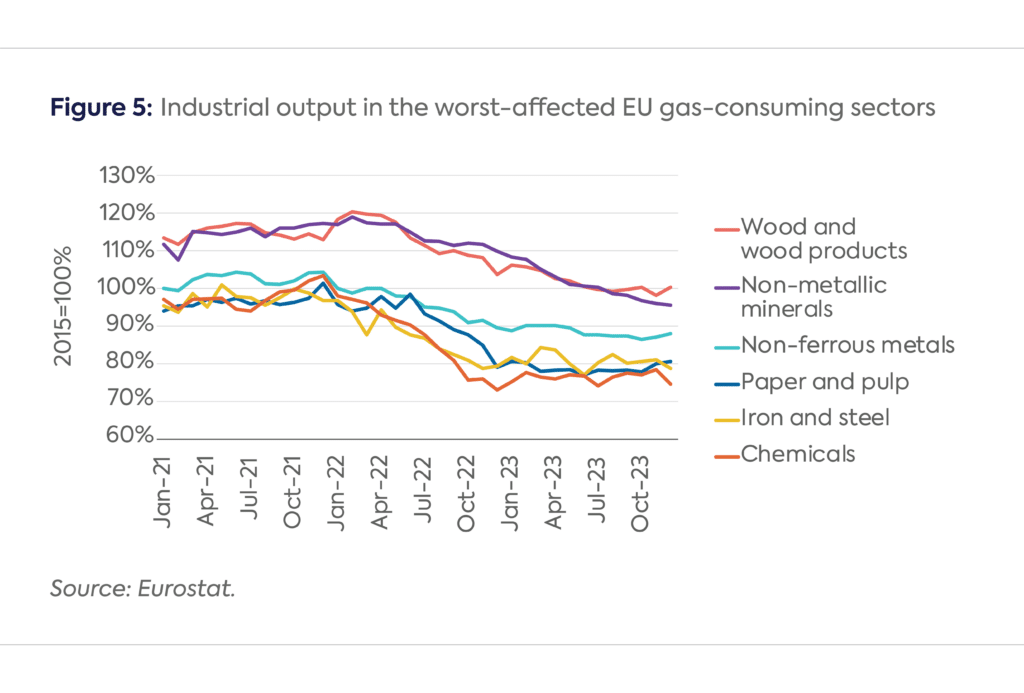
Among the worst-affected (mostly energy-intensive) industries, the chemicals sector was the hardest hit, with total production dropping by 25% between January and December 2022 and recovering only marginally since the beginning of 2023. The iron and steel, paper and pulp, wood and wood products, non-ferrous metals, and non-metallic minerals industries also experienced heavy production losses, down by 12 to 21 percentage points as of December 2023 relative to January 2022 levels (Figure 5).
Potential Causes for Sustained Weakness in EU Industrial Activity
The enduring weakness of industrial activity within the EU (notwithstanding a tentative recovery since the second half of 2023) cannot be explained by a single variable. Price risk mitigation strategies at the corporate level, energy subsidies at the national level, substitution of energy-intensive goods with extra-EU imports at the regional level, and broader macroeconomic headwinds—at the EU level and globally— offer the most compelling explanations for the sustained slump in industrial output.
Price Risk Mitigation Strategies
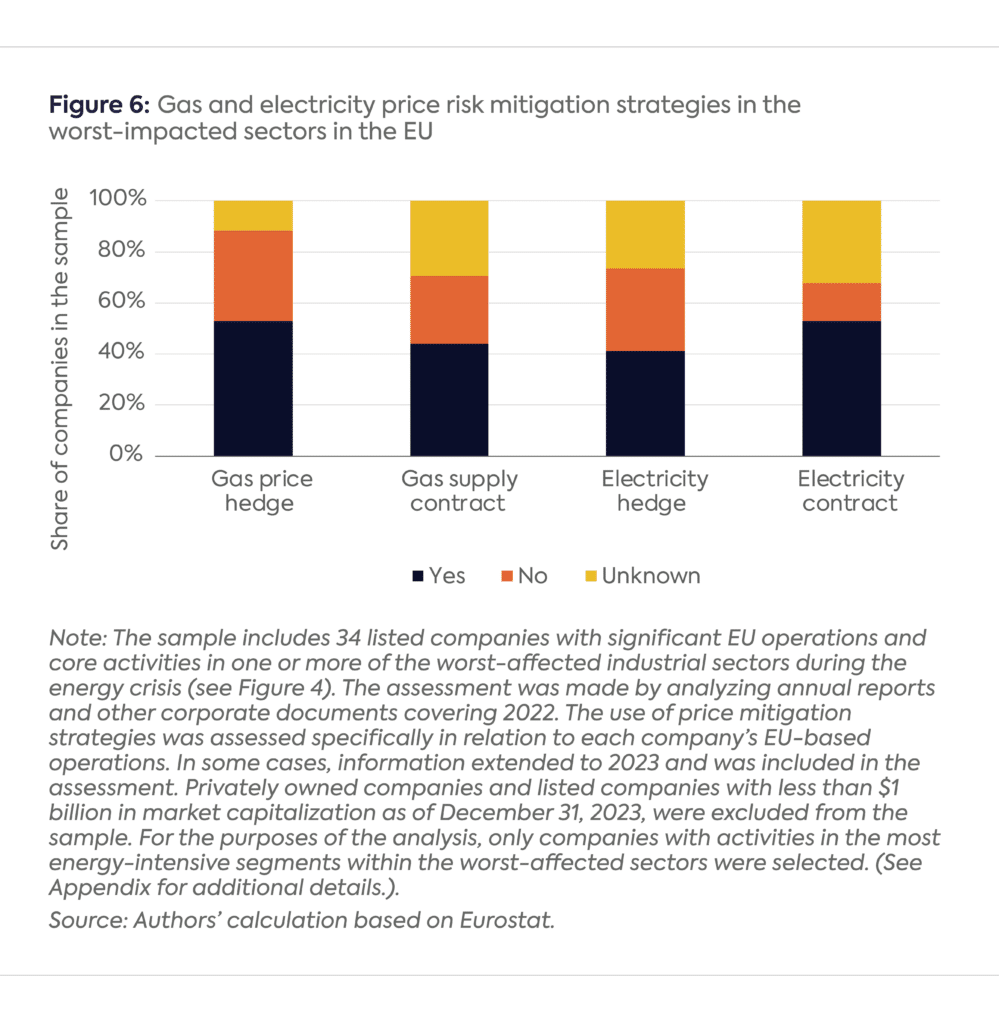
Industrial players across the EU have not been equally exposed to high and volatile energy prices in 2022–23. Large industrial producers that depend on external gas and electricity suppliers typically manage their price risk with hedging (using options and swaps), fuel supply contracts (using fixed-priced or indexed formulas), or both. A detailed analysis of the annual reports of 34 large, publicly listed companies operating in the worst-affected energy-intensive industries in the EU shows that gas and electricity hedges and supply contracts were indeed widely used in 2022. The number of companies using a specific tool in each category exceeded the number of those that did not (Figure 6). To the extent that companies were able to lock in favorable gas and electricity prices in 2021 for one or more years, hedges and contracts could have provided a measure of protection against surging energy prices during 2022 and delayed the negative impact of high prices on industrial activity to 2023 or beyond.
However, even in the case of large listed companies with sophisticated risk management operations, hedges are typically short-term (with maturities of 12 months or less) and both hedges and contracts cover only a small proportion of total consumption. Therefore, the price relief such risk mitigation strategies could provide during 2022–23 was partial and time-limited at best, meaning many industrial producers had to reckon with some adverse price impacts, even if they enjoyed a degree of protection from the worst increases during the energy crisis.
Energy Subsidies
EU governments rolled out energy subsidies and other support measures worth €540 billion to shield their domestic consumers from rising energy prices amid the 2022 crisis.[iv] The vast majority of these subsidies targeted households and small businesses, but a handful of countries also offered price caps, fuel tax cuts, and compensation schemes for surging energy bills to large energy-intensive industries. Most of these support schemes were rolled out from the second half of 2022 and extended into 2023 or even 2024. Initial assessments suggest, however, that only a fraction of the available amount had been used through mid-2023 across the EU.[v] Additionally, there were conditions attached to the relief that member states could offer to industrial users under the EU’s Temporary Crisis Framework (TCF). For example, the maximum level of assistance for energy-intensive industries in Annex 1 was limited to €150 million per “undertaking,” including transfers to offset higher energy costs.[vi] The aid was also proportional to the increase in energy costs and conditioned on a 40% or greater drop in earnings before interest, taxes, depreciation, and amortization (EBITDA) relative to 2021 levels.
To the extent these subsidies were offered and disbursed, their impacts were similar to that of hedges and other price risk mitigation tools: they shielded large industrial energy users from the full effect of record-high energy prices in 2022, and smoothed out the rollercoaster ride of gas and electricity costs during the 2022–23 period.
A comparison of aggregate industrial output in countries that have offered meaningful fiscal support to large energy-intensive industries with the output in countries that have offered little or no support indicates that subsidies likely had a modest but measurable impact on industrial activity, especially in H2 2022 and throughout 2023 (Figure 7).
Nearly all of these support schemes are set to expire at the end of 2023 or during 2024. Unless they are further extended, energy-intensive industries in the subsidizing countries will be more exposed to gas and electricity market prices, which are still comparably high by historical standards—and could face a more prolonged recovery as a result.
Substitution with Imports
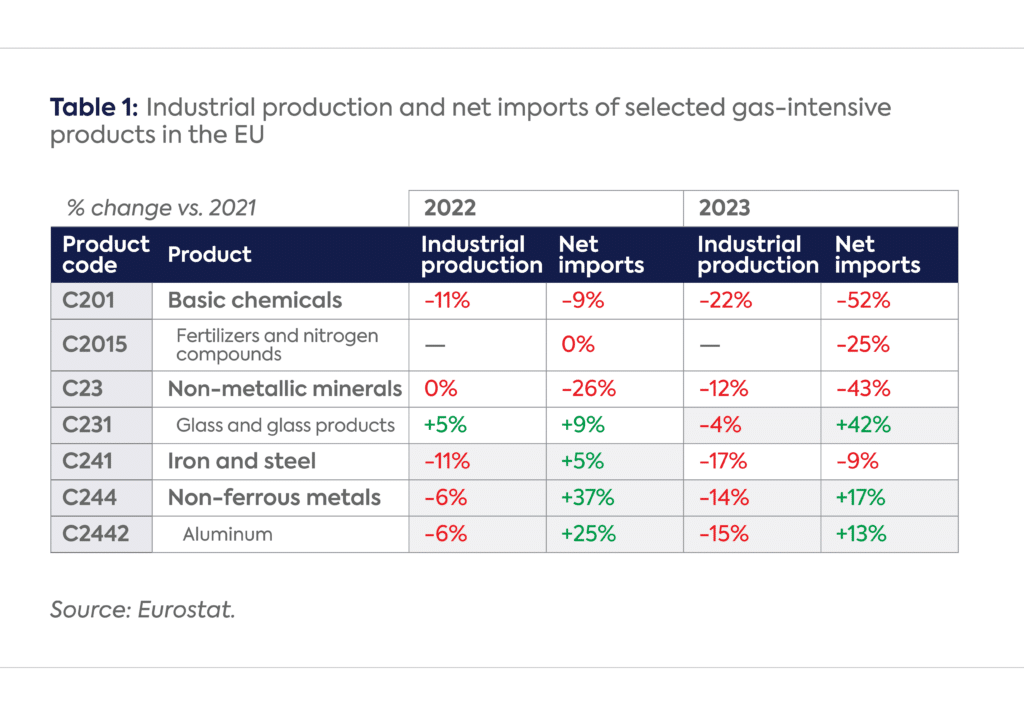
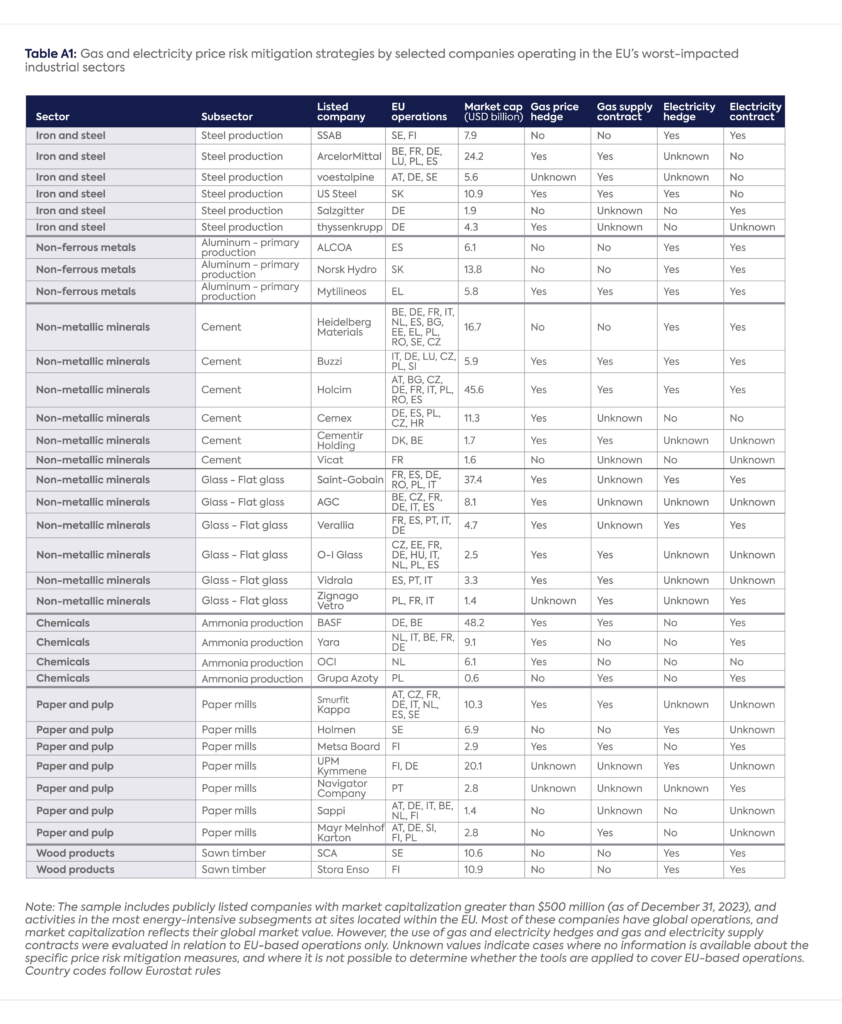
Initial analysis of the demand response during the energy crisis suggested that some industries may have reduced their gas needs by substituting locally produced gas-intensive intermediate goods with imports from outside the EU.[vii] Detailed data on extra-EU trade of energy-intensive products indicates that such “import substitution” was indeed prevalent since the start of 2022, but only in certain subsegments of the worst-affected industries, and in some cases only for a limited period (Table 1).
Chemicals: The chemicals sector saw significant and sustained production losses in 2022–23. However, imports of fertilizers and nitrogen compounds remained flat in 2022. The aggregate numbers by Eurostat mask important differences between nitrogen-based fertilizers and those based on phosphorus and potassium. According to Fertilizer Europe, net imports of the three fertilizer categories combined increased slightly from 3.7 million tons in 2021 to 3.9 million tons in 2022. However, net imports of nitrogen-based fertilizers, which are responsible for the bulk of gas consumption within the fertilizer segment, increased from 1 million tons in 2021 to 2.8 million tons in 2022.[viii] Major European fertilizer manufacturers, such as Yara and BASF,[ix] announced ammonia production cuts within the EU while simultaneously increasing ammonia imports to keep their European chemical plants running. The situation started to improve in 2023 as some of the previously curtailed production capacity reportedly restarted amid moderating energy prices since late 2022. However, some of the leading fertilizer producers, including Yara, have plans to continue importing ammonia feedstock to their European plants in the foreseeable future.[x] The European Chemical Industry Council (Cefic) also emphasized in recent statements that lower energy prices, especially in North America, are “wrecking” the competitiveness of European chemical producers.[xi] This suggests that some import substitution could continue as long as European energy prices remain well above the historical norm.
Non-metallic minerals: Industrial production has been falling in this sector since mid-2022, but glassmaking held up relatively well until 2023 due to extensive hedging and the costly and time-consuming process of restarting production lines in glass manufacturing. Imports of glass products rose sharply in both 2022 and 2023, likely substituting for a measurable part of domestic production, especially in 2023.[xii]
Iron and steel: Steel imports increased against the backdrop of weak domestic production for much of 2022, though the robust import numbers in 2022 gave way to a sustained drop by 2023. The European Steel Association (Eurofer) attributed the 2022 dynamics to third-country exporters continuing to “flood the European market despite a slump in demand.”[xiii]
Non-ferrous metals: This sector—with aluminum its largest energy consumer—saw widespread substitution of domestic production with imports in both 2022 and 2023.[xiv] In 2022, European aluminum smelters reportedly cut production by more than half.[xv] Restarts have been limited throughout 2023 due to import competition and weak demand, and some analysts believe that most production curtailments in the aluminum sector could last until 2025 or even become permanent.[xvi]
Macro Headwinds
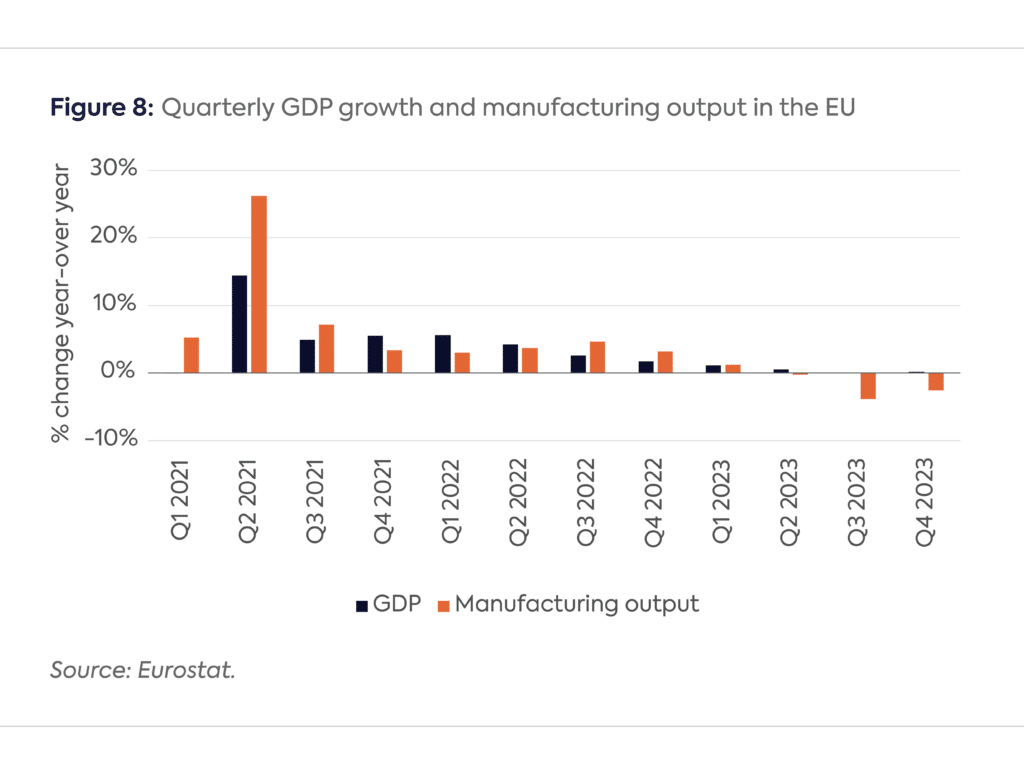
The absence of a noticeable recovery in gas-dependent industrial sectors in 2023 despite substantial price declines suggests that the price pressures during 2022 might have given way to other macroeconomic headwinds, which continued to suppress industrial activity through 2023. This period witnessed a progressive deceleration in GDP growth across the EU, which ground to a complete halt in the second half of 2023 (Figure 8). Several countries, including Germany, reported negative GDP growth in both Q3 and Q4 2023, and Germany’s GDP is estimated to have dropped by 0.3% in 2023 as a whole.[xvii] Weak foreign demand for industrial products has been cited as one of the main reasons for Germany’s poor economic performance.[xviii]
This slowdown among gas-dependent industries coincided with a broader downturn in industrial activity. Growth in the manufacturing sector, which remained fairly resilient throughout the 2022 energy crisis, started to decelerate markedly in Q1 2023, ground to a complete halt in Q2 2023, and dove deep into negative territory in Q3 and Q4 2023, the first such declines since the Russian invasion of Ukraine. Given that roughly two-thirds of the manufacturing sector’s output (in monetary terms) comes from industries that are not particularly energy-intensive,[xix] broader macroeconomic forces are likely contributing to the EU’s downturn in gas-intensive and non-gas-intensive industries alike.
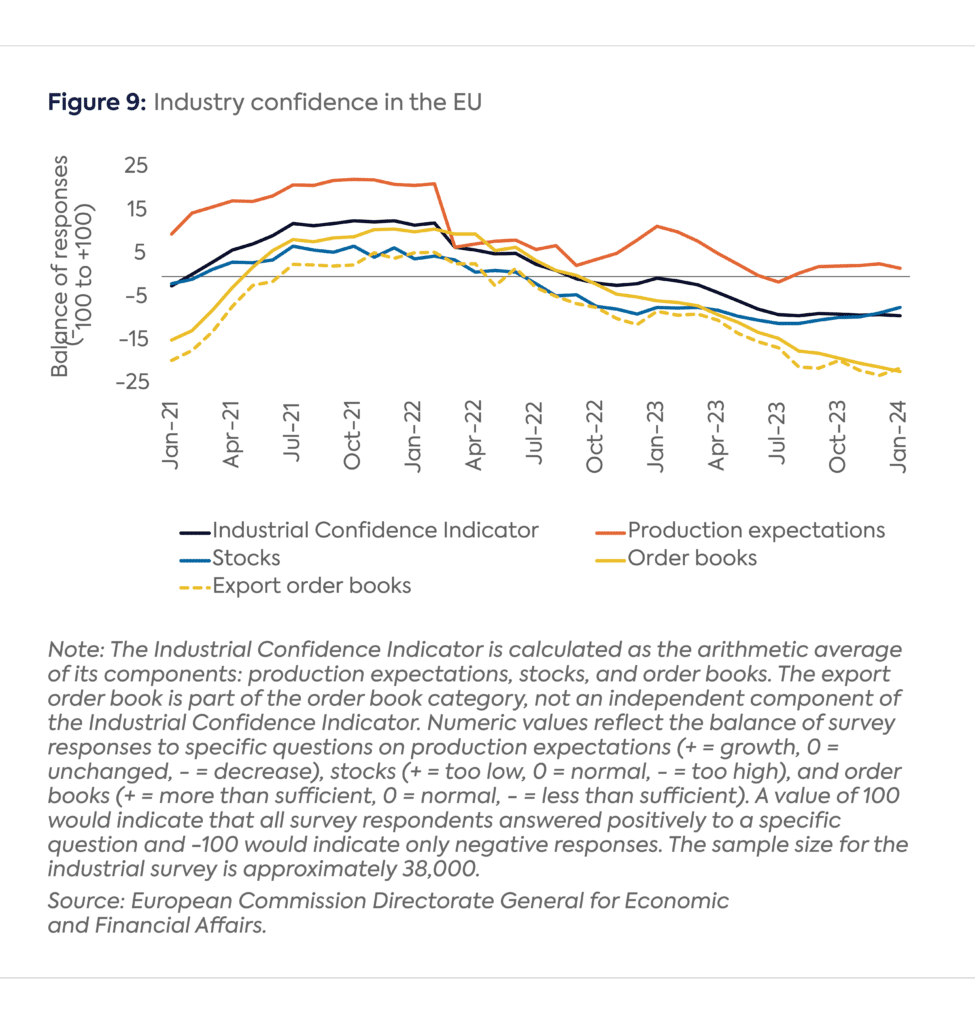
This broadly negative economic outlook since the start of 2023 is reflected in business confidence surveys. The European Commission’s composite Industrial Confidence Indicator plummeted after the Russian invasion of Ukraine, and after a brief pause at the end of 2022 it continued to decline in 2023, finishing the year in deep negative territory. The mood in Germany, the EU’s economic engine, remained especially “bleak” in early 2024.[xx] The index shows that excess stocks of finished products and insufficient orders (especially for exports) weighed particularly negatively on growth expectations (Figure 9). Other economic indicators, such as S&P Global’s composite Purchasing Managers’ Index, confirm this dynamic.[xxi]
Conclusion
The 2022 energy crisis came as a shock to EU-based industries, particularly those in energy-intensive sectors. Hedging, fixed-price fuel supply contracts, and government subsidies provided partial and temporary relief and prevented gas demand from falling even further. But the fact that industrial gas demand still remains 17% lower in Q4 2023 compared to Q4 2021 despite lower gas prices in 2023 indicates that the damage caused by the crisis has been substantial and likely long-lasting.
Predicting the speed and scale of industrial gas demand recovery in the EU is beyond the scope of this commentary, but the enduring challenges facing gas-consuming industries in 2023 and beyond signal that the recovery will likely be more gradual than the price trajectory alone would suggest. Lower spot prices for natural gas—possibly from 2025 onward—will be far from the only factor setting the pace for the rebound of industrial gas use. Germany will be a key country to watch, given its dominant share in industrial gas demand within the EU.
Our analysis points to a partial recovery at best, for a number of reasons.
As the mitigating effects of government subsidies and corporate risk management strategies wear off, energy-intensive industries are more exposed to lower—but still historically high—fuel prices in early 2024. Price mitigation strategies are time-limited, and it is highly unlikely that industrial users are still benefitting from low price levels locked in before the war. The best they can do is optimize their energy costs based on current market conditions. Energy subsidies are also unsustainable in the longer term. European governments spent record amounts to shield consumers from high energy prices in 2022–23, and face growing investment requirements associated with the energy transition. Many of them are already indebted due to back-to-back COVID and energy crises, and have limited fiscal room to support energy-intensive industries aside from those that are transitioning to cleaner energy sources.
Import substitution in some energy-intensive sectors—and broader macroeconomic headwinds for manufacturing activity—have prolonged the weakness of gas-consuming industries, especially in 2023. These headwinds are unlikely to subside soon. As of March 2024, the forward curve for the TTF benchmark still indicated price levels of around €25–30/MWh through 2028, markedly higher than the historical average of €15–20/MWh observed over 2015–19. Even if European gas prices returned to those historical levels, energy-intensive industries across the EU would still face immense pressures from overseas competitors in North America (where the Henry Hub benchmark was trading at well under the equivalent of €10/MWh in early March 2024) and from other producers benefiting from artificially low regulated gas prices, including those in the Middle East and North Africa. Long-term decarbonization goals are also increasingly weighing on EU industrial gas demand. One of the main objectives of the REPowerEU plan is to reduce European gas demand, including by replacing industrial gas use with electricity and hydrogen. The frontloading of electrification and hydrogen uptake envisioned in the REPowerEU plan will likely forestall a significant recovery of EU industrial gas use in the foreseeable future.
[iii] Also referred to as non-LDZ (local distribution zone) demand, which encompasses large industries as well as other large consumers (including power generators) that are directly connected to the national gas transmission network.
[vi] Energy-intensive industries are defined as industries whose purchases of energy products (including energy products other than natural gas and electricity) amount to at least 3.0 percent of the purchase of the production value or turnover, based on data from the financial accounting reports for the calendar year 2021. Annex 1 companies, which are eligible for the most generous support under the Temporary Crisis Framework, are firms that are active in sectors at risk of carbon leakage. For energy-intensive companies in Annex 1, the aid is limited to 80 percent of the maximum eligible costs. See European Commission, “Overview for Support Possibilities under Section 2.4 Temporary Crisis Framework,” October 28, 2022, https://competition-policy.ec.europa.eu/system/files/2022-10/TCF_Overview_of_support_options.pdf.
[vii] Zeniewski et al., “Europe’s Energy Crisis: What Factors Drove the Record Fall in Natural Gas Demand in 2022?”
[xii] Glass for Europe, an industry association, also alleges that some of the EU’s growing imports of flat glass are originating in Russia and entering the EU illegally through third countries (particularly Belarus and Montenegro) in contravention of EU sanctions. See Glass for Europe, “Ban on Imports of Flat Glass from Russia, Trade Flows and Circumvention Practices,” position paper, July 2023, https://glassforeurope.com/ban-on-imports-of-flat-glass-from-russia-trade-flows-and-circumvention-practices/#.
CHRONIQUE. Nouvelles usines de liquéfaction et augmentation des exportations expliquent, entre autres, pourquoi les prix du gaz ne connaissent pas le pic observé en 2022, lors de l’invasion de l’Ukraine. Mais cette stabilité des prix ne traversera pas l’été, écrit Anne-Sophie Corbeau, spécialiste de l’énergie au Center on Global Energy Policy de l’Université Columbia