Steve Hamburg: The key here is if we’re going to address this real crisis of climate change, we need to have radical transparency with regard to where are those emissions coming from and how do they vary over space and dime, so then we can take really effective action.
Bill Loveless: The Environmental Defense Fund wants to take the guesswork out of locating methane emissions. In a new partnership with Google, EDF has developed a satellite that will orbit the earth 15 times a day and monitor both high emitting sources and smaller, more dispersed ones. The satellite called MethaneSAT will provide specific data on which pots of oil and gas infrastructure are the biggest methane emitters. Using artificial intelligence, MethaneSAT will overlay emissions data on oil and gas infrastructure maps to pinpoint the components that are responsible for methane leaks. So what are the implications of this new methane detection technology? And can it be expanded to detect other greenhouse gases? This is Columbia Energy Exchange, a weekly podcast from the Center on Global Energy Policy at Columbia University. I’m Bill Loveless.
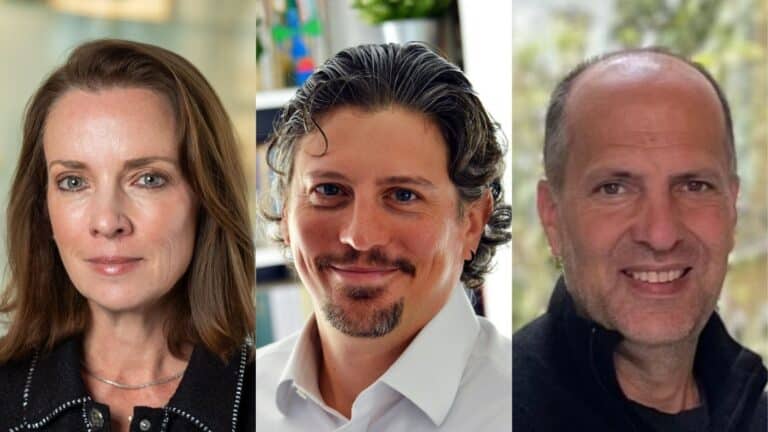
Today on the show, Steve Hamburg. Steve is the chief scientist and a senior vice president at the Environmental Defense Fund. He leads the organization’s work to quantify methane emissions and understand the impacts on air pollution and human health. Before joining EDF in 2008, he was an environmental science professor at University of Kansas and Brown University where he was the founding director of the Global Environment Program. He has also served as a lead author for the Intergovernmental Panel on Climate Change and was acknowledged as one of the contributing recipients of the 2007 Nobel Peace Prize. I spoke with Steve about the capabilities of MethaneSAT and how they differ from other satellites that detect methane. We discussed how artificial intelligence will be used to map oil and gas infrastructure and how information from the satellite could be used to enforce new environmental protection regulations in the United States and other countries. Here’s our conversation, Steve Hamburg, welcome to Columbia Energy Exchange.
Steve Hamburg: Oh, my pleasure.
Bill Loveless: You’re one of the world’s premier experts on methane emissions, but not on satellites, at least not until lately. It’s a pretty new field for you. What have been the challenges?
Steve Hamburg: Well, so I’ve used satellite data for a long time in my career from before I used joined EDF, but it really is a very different world to build a satellite and to ensure that it’s going to provide the data that we really need. So to do that, I had to find somebody who could partner with me, and that was Tom Ingersoll who came commercial space. And he was my partner very much in building it because he knew how to build it, and I understood how we were going to use the data and what data we needed to produce, and thus was the partnership. Tom Ingersoll was… He came out of the industry, and he was based in California and had sold his company. And we were able to attract him to join EDF because of the mission, and as we did many of the team members.
We have members from many different industries, so coming out of commercial space, coming out of government, coming out of academia and brought them together. So this mission was really one where people were excited about making a difference and bringing their expertise to bear on providing policy relevant data of a quality we’ve never seen for greenhouse gas emissions, and particularly, we’ve never seen a focus on an entire sector where we’re going to provide data across an entire sector around the globe, which with a level of transparency, I call it radical transparency, which is really a game changer in my mind.
Bill Loveless: Well, soon, EDF will launch MethaneSAT. It’s a satellite as I understand that promises to provide more information than ever on methane emissions from oil and gas operations around the world. And of course, as we know, it’s a gas that’s much more potent than carbon dioxide at trapping gas in the atmosphere
Steve Hamburg: In the near term. It’s a short-lived climate pollutants. So this is all about impacts over a couple of decades.
Bill Loveless: Right. Tell us about MethaneSAT.
Steve Hamburg: So MethaneSAT is a cutting edge satellite. And we started, we designed it, we conceived of it, and that conception was myself with Steve Wofsy, who’s a professor at Harvard. And we came up… We sort of came up with the idea. And we did it not based on technology. We based it on need. So we took the data that we had helped coordinate at EDF to look at emissions of methane in the Barnett region of Texas. We coordinated a campaign with 12 science teams now just a little over a decade ago. And we took that really in-depth look, the most in-depth of any place in the world at that time. And we said, what kind of data would we need to get out of the satellite to be able to recreate what we learned with those 12 teams working two weeks collectively in the Barnett region?
And then once we had those specifications, we went to those who know how to build satellites and said, can you build something with this level of precision? Because it was really a big step function in terms of getting much greater precision in the measurements than was available at the time or in planned in any missions. And after some hard thinking, there had been some new technology coming into the industry that we were able to take advantage of and build this very precise instrument with fine spatial resolution, but yet looking at a fairly wide swath. So it’s got 220 kilometers wide swath, so we can see a whole oil and gas basin in most cases and provide very granular data. So we’re looking at the data at 130 meters by 400 meters, so very fine data which we can aggregate to square kilometers. So our basic unit is a square kilometer and get a very clear understanding of the total emissions, how those emissions are distributed across the area, which then allows us to track change over time, which currently we can’t do. So our emissions going up or down?
Bill Loveless: It’s going up, it sounds to me like. When will this launch take place, Steve?
Steve Hamburg: So the launch will be just coming right up. It’ll be in March, and hopefully in early March. And the data won’t start flowing instantly. We have to always sort of caution people. We’ve got to commission it, make sure everything’s working, and then start collecting data and work through some of the quality issues just to make sure everything’s really good. But we will start putting data out in a few months and we will be at full production by the end of 24, beginning of 25.
Bill Loveless: And my understanding is the launch will take place at the SpaceX. Well, you’ll be using a SpaceX Falcon9 Rocket. The launch takes place at Vandenberg Space Force Base in Santa Barbara, California.
Steve Hamburg: That’s correct. And we’re on a ride share, so we’re just one of many satellites that will be put into orbit on the Falcon9, which is a very big powerful rocket.
Bill Loveless: How much does this project cost, Steve? And who’s paying for it?
Steve Hamburg: So this has been philanthropically funded, and the build and launch portion is $88 million. And that’s, in the satellite world… As one of the folks who came out of commercial space said, “You did this on a shoestring.” It doesn’t feel like that. It’s a lot of money. But if you compare it to what government spends to put up a satellite in comparable, this is a very lean operation, and yet we are really breaking lots of new ground. And as I said, the ability to, the precision with which we’ll be able to measure these emissions is unparalleled by anything currently flying and currently proposed.
Bill Loveless: Yeah. And you say it’s philanthropic. Where’s the money coming from?
Steve Hamburg: It’s coming from individuals and foundations that have saw, understood the vision and wanted to help make it a reality.
Bill Loveless: Yeah, I understand Bezos Earth Fund is one.
Steve Hamburg: Bezos Earth Fund was one that contributed to the mission, yes.
Bill Loveless: You mentioned other satellites. There’s others circling the globe now, shedding light on the emissions of methane. But as you note, MethaneSAT changes the game in some key ways. What can we see from space today, and how well methane sat compared to those options?
Steve Hamburg: So we have seen some really big improvements in our satellite observation of methane over the last few years. Most notably, we can think about TROPOMI, which is a European space agency instrument that they put up in late 2017 that gives us a global picture, but it’s a fuzzy picture. It has very large pixels. So it’s about not quite 40 square kilometers, and it has better precision than we had before, but not as much as we need. So we kind of think of it as having a fuzzy picture, not very good glasses. So you start to understand the distribution. And if there are a lot of emissions, in places where there’s a lot of emissions like the Permian Basin, you can see it pretty darn well and you can understand the total there. But it can’t effectively look at emissions across all the basins on a regular basis and create a spatial distribution of those emissions.
And the key is we need to be able to answer three basic questions. Where are the emissions? How much are the emissions? And how do they change over time? And MethaneSAT was designed to answer those, specifically those three questions across the globe. Whether that’s areas with low emissions, high emissions, highly distributed emissions, we’ll be able to see all of that. There’s also a great satellite from the Japanese space agency called GOSAT. The first one was put up a while ago. The second one was put up in 2017, I think 2018, excuse me, I believe. And they’re going to put up another one in the coming year. And so they provided, again, some great data sets.
And then we have these target mode instruments. So they’re two broad categories of satellites. You have mappers that kind of map the area, and then you have target mode. We’re thinking of it as a soda straw or a telephoto lens. You look in at a small area, and you can see that with much more granularity than you can with the mapper. We kind of sit between the two. We are bringing that higher precision that’s more granularity, but still a wide swath, not as wide as TROPOMI, but not as fine as the target mode, because we determined, if I mentioned before, we’re trying to produce policy relevant data. So we’re trying to answer, be able to generate the data in a way that’ll allow good decisions to be made, whether you’re a regulator, you’re a company, or you’re a civil society. And so we designed it specifically to answer those questions, which fell between these two classes of satellites. So we’re sitting between them. And that gave us the precision, the spatial resolution, and the repeatability to build this global picture.
Bill Loveless: Before satellites, what were the best means of recording methane emissions?
Steve Hamburg: Well, you can do it. We didn’t do a lot of it, to be honest, until recently. So the efforts to measure, let’s say oil and gas methane were limited prior to the 2010, 2011, were the real first big efforts to do that. And you can use sensors that measure the air, the concentration. You can put those on cars, you can place them in fixed spots on towers, and that allows you to start to understand the emissions in specific sites over areas, and that the science has matured wonderfully over the last 12 or 13 years so that we can, on the ground, get a very accurate picture. But we realized we needed to go to space because we were doing a lot of that work with literally hundreds of scientific collaborators, and we were building a really very detailed picture of emissions in the us, much more detailed than we had anywhere else in the world.
And we published a paper in science in 2018 bringing all that data together, there were, I believe it was 26 co-authors from 19 institutions, so very collaborative effort. But we needed to do that at every basin around the world, and we needed to do that continuously. And we just didn’t have the resources, let alone the money. But even if we had the money, it just wasn’t physically possible. The only way we can provide the quantity of data to produce this radical transparency was to do it with satellites that could be constantly collecting. So with MethaneSAT, we’re going to collect about 30 of these 200 by 200 kilometer target areas every day, every day of the year for as long as that satellite stays up, which we hope it’s designed for five years and we’d hoped it goes considerably longer. So that’s a lot of data.
We couldn’t do that from the ground. And that was the realization we had when we designed the mission, was that everything we were doing in the community, the scientific community, it was fabulous. It was giving us enormous amount of insight, but we just couldn’t scale it. And we know we couldn’t get access. We’ve tried to get access to lots of airspace in different parts of the world, and you just can’t. We’ve even had collaborators put planes in the air that somebody says, “No, no, no.” Even after we thought we had permission, “You’re not coming. You turn the plane around.”
Bill Loveless: You had to do it yourself.
Steve Hamburg: Yeah, we had to put the satellite up so you can look everywhere. Because it’s a commons, you can fly and take images around the world.
Bill Loveless: There are millions of oil and gas wells around the world. How widely, and for that matter, how specifically will the satellites view of them be?
Steve Hamburg: Well, we’ll see almost all of them. So we have made a commitment to view regions that produce at least 80% of global oil and gas, and that’ll take us about 150 of these targets to capture that area. To get the next 10%, so bring it up to 90%, takes an equal number of targets, and it gets ever more diffuse as you move away For those. We really aren’t going to be able to get a hundred percent, but we’re going to get the overwhelming majority of those emissions, and there’ll always be something out on the margin. So that’ll allow us to create this very comprehensive picture in a very consistent way. And the other thing I should mention is the satellites collect concentration data. They tell you the distribution of methane near the surface of the earth, and that doesn’t tell you how much is being emitted.
The other thing we’ve done with MethaneSAT is to automate what’s referred to as the inversion. Think about it. You’re getting a picture of concentration, and you really want to know is where all of that methane came from. It’s now diffuse. And so you have to run the movie backwards. And that inversion, which is a sophisticated set of algorithms needs to be done and needs to be done in an automated way so that every one of those targets that comes in, those 30 a day, 365 days a year is fully analyzed in a automated way with a minimal amount of touching so that you’ve got a mass produced product of high quality. So we have built that data platform system. It’s the first one to do this in an automated way as the base data product for a satellite mission that I’m aware of. And that’ll allow us… Now, we still have work to do on it, but we have actually used aircraft based data that we collected very similar to MethaneSAT, to work out a lot of the kinks in the system.
And we have a whole team of software engineers and scientists who’ve been working on the development of this system for many, multiple years. And so when the satellite goes up in a few weeks, we will then start to commission it, and then start to collect the data. And then of course, we’ll be looking at it to make sure we understand how it’s performing and doing all the quality checks. That’s why we can’t immediately produce all the data we will be able to, but that system is key. It’s a factory we want to create, just like you now get imagery, right? We get it at a scale we never could imagine. It clicks it, it gets processed, and you can download it. That’s what we want for greenhouse gas emissions and have just such an automated system. We believe we’ve built it, and we’ll be deploying it, and it will be fully operated and running the factory at the beginning of next year.
Bill Loveless: Will any part of the world be out of view? I’m thinking Russia, for example.
Steve Hamburg: Yeah, so we’ll be able to see Russia. It’s passive, so we use natural light. So in December, in Northern Russia, no, we won’t be able to see it because it’s dark. In West Africa, we will see it less often because there are lots of clouds. We can’t see through clouds. Now, because we have very fine pixels, if there are only a few scattered clouds, we can block those clouds out and still understand the pattern. If it’s largely cloud covered, then no, we have to go on another day. So we actually have software that looks at the weather on a global basis and decides, is it going to be a good day there in two or three days? If it is, okay, we plan to go there. If it’s a bad day, we are not going to waste one of the targets taking basically a picture of the clouds, which is of no use. And so that way, we can maximize the useful data we collect and maximize the data we can collect from those places that are harder to see, like in Western Africa.
And obviously in northern latitudes, we want to collect data in the seasons when it’s possible.
Bill Loveless: Yeah, I’m thinking… I was just reading this week, apparently a massive methane leaks in Kazakhstan and was wondering, boy, if MethaneSAT was up there now, what would it be telling us? How would it be helping us to address that type of situation?
Steve Hamburg: Yeah. So you can use the target mode instruments. That’s what we’ve been seeing those emissions. And the key there is we don’t know what proportion the really big ones are of the total, and it could be a minority. It could be way worse than it looks with what we’re seeing now because we’re only seeing the big emission sources. And there can be a background of lots of other emissions, or it could be that they’re the represent the majority of what’s being emitted. Currently, we can’t always tell that. I don’t know actually in that case whether TROPOMI, the European Space Agency, can actually figure that out. I haven’t seen that data. But in many cases, it can’t.
Bill Loveless: Google is an important partner of EDF in this venture, as you note. It’s artificial intelligence and infrastructure mapping is a key element of the effort. What is and what will be the tech giant’s role here? How will it compliment the satellite’s findings, and how will it make the information available?
Steve Hamburg: So they’re working with us on the computing. This is all a cloud-based system we’ve developed. And then they will be providing the outlet for that. We’ll have a portal, we’ll have a website. You can go look at the data. But if you want to download it, and it’s important to say that all the data will be free for non-commercial purposes. So if you’re an academic and you want to use the data, you’ll be able to go to Google, to Google Earth Engine or Google Marketplace, depending on what you want to do with it. And you can download it. Just sign a non-commercial license that says, “Yeah, I’m not going to resell it. I’m not making this into a commercial product, not doing something commercially with it.” Then you can just download it and you have full access to all the data on the Google website. They’re also helping us with taking their capabilities to push the limits on some of these analytic tools, which we’ve developed, and they’re leaning into helping us in places where they have expertise.
We have built this oil and gas database using publicly available data. So we’ve gone out and found all the data around the world so we can create a transparent database. And then they’re exploring using to fill in gaps with machine learning.
Bill Loveless: And I understand that EDF developed algorithms in collaboration with scientists at Harvard University School of Engineering and Applied Science and the Center for Astrophysics, and as well as scientists at the Smithsonian Astrophysical Observatory.
Steve Hamburg: Yeah. And so Steve Wofsy, who’s been my partner in thinking, envisioning MethaneSAT, is at Harvard, is a professor at Harvard, and he’s really been a key partner from day one. And he brought in the Smithsonian Astrophysical Observatory, and the team there, Kelly Chance and his team, because they were the ones who knew how to really design and build and challenge the… Peter Schmitz, who’s an engineer there, was fabulous in figuring out, how could we build this thing? Steve’s a wonderful spectroscopist and has made aircraft based measurements for many decades throughout his career. And I know on the ground part, and they helped us with the actual satellite piece to envision what we could do. And so they were an integral partner in maturing this concept. And then they’ve been a partner working on the algorithms, as you said, as part of the science team. So Steve serves as the principal investigator of the project. I serve as the overall lead of the project, but we have a lot of people, dozens and dozens of people scattered around the world who’ve been leaning in and making this possible. This is very much a team effort.
Bill Loveless: Yeah. As you note, Google is using AI to map out map oil and gas infrastructure to create this global map, right? I’ve seen a comparison to how Google would use AI to identify street signs and roadways on Google Maps.
Steve Hamburg: Yeah. So the base map, as I said, is actually using public information. So we, with internal TDF, had done that by just basically doing crawlers and collecting all the data that’s out there. And so that’s the bulk of it. And the key was we wanted to make it transparent, so then when we map the emissions, we can show you what are the potential sources or the sources if we know them. Because in a lot of cases they’re diffuse emissions, right? What we’re seeing in most cases is the majority are diffuse. What do I mean by diffuse? They still may be coming from points, but a little here, a little there, but it all adds up. And some cases for agriculture, it’s actually truly diverse of diffuse. So we’re talking about things like rice, right? It’s just coming from the entire area. I’ll come back to agriculture in a minute. But so we want to be able to show that, okay, in this square kilometer, there may be several well sites or several other sites.
And the emissions aren’t high enough that we can say, “Ah, there’s this much from this point, which we’ll be able to see. But there’s this diffuse emissions, and here’s the area and here’s the infrastructure from which it could be coming. We are also partnering with New Zealand Space Agency. They’re a partner of ours. And so they’re actually operating the satellite. They will have the missions operations center at the University of Auckland. And also, they’re taking care of the agricultural observation. So they have put together funded a team in New Zealand led by Sarah Mikaloff-Fletcher at the NIWA, and they’re putting together the science and support of making observations of methane emissions from agriculture. So we really have a dearth of data on agriculture on a global scale in terms of methane emissions, and they will be helping us. And they will have some of the targeting capacity within methane set to build that database as well.
Bill Loveless: Yeah. I want to ask you a bit more about other sorts of emissions in a minute, but just again on Google, EDF’s worked with Google in the past, some years ago, they had. And what was that work?
Steve Hamburg: So we’ve done a couple things. So we did a project now a decade ago to map methane emissions from local distribution systems. So they put methane analyzers in the back of Google Street view cars. And then as they drove around, they made measurements. And then working with Colorado State University, our team at EDF and the folks at CSU, Jovan Fisher led that. We built the algorithms to interpret that data so we could identify where the leak indications are. And we call it deliberately because you still have to investigate them, but they’re almost always associated with a leak. And then we mapped and made public for the first time 12 cities.
Not only did we map where there were leaks, we actually quantified them so we could say, “Are they really big? Are they medium? Are they small?” And then we can show that if by knowing that information, if you focus on the larger leaks, you can dramatically reduce the overall emissions from the system without repairing more leaks. Now, we want you to repair more leaks, but even if you don’t and you just focus on the bigger ones, your emissions conservatively can be drop in half so you don’t have to spend more money.
Bill Loveless: What happened as a result of those detections? Were actions taken by local distribution companies?
Steve Hamburg: Absolutely. And public utility commissions in some cases required companies to start collecting this kind of data. There are now commercial companies that offer this service. So we did this to get sort of the vision out there of what could be done, and making data like this public. It wasn’t public, and there was no reason why it couldn’t be. And we were really clear, right? If we found something, which we did, that was at such high levels, it was dangerous, we called it in like anyone should, and we made sure it was repaired and we stayed on top of it. So these are environmental concerns, and the distributions vary, and then we need a transparency. The key here is if we’re going to address this real crisis of climate change, we need to have radical transparency with regard to where are those emissions coming from and how do they vary over space and time?
So then we can take really effective action rather than kind of blurring the picture. We might know the total in a blurred way, but that’s not as actionable, having a good set of glasses on with a really crisp picture of where they are, how they’re operating, how they’re changing. Then we can really take targeted action. So this work we did with Google with the street view cars, they provided the data. They did the driving. We asked them where to drive. And then we handled all the science, and then we posted that all publicly, and then used that to drive public utility commissions and utilities taking more focused action to reduce those emissions. The next project we worked on with Google was actually on hyperlocal air quality. So when you see descriptions of air quality in most places, you’re seeing it in a very averaged way across the whole city or a large chunk of a city.
Nobody breathes average air. You breathe the air near where you live or you work or you’re walking or you’re running, and there’s a high amount of variability in the air quality across those scales. So we actually developed a technique, jointly with Google, again, put the instruments in their street view cars and drove, and then we focused with academic researchers, Josh Apte, who’s now at University California, Berkeley, and developed the algorithms to turn that into hyperlocal maps of air pollution. Sort of every 50 meters, what does it look like? And then working with Kaiser Permanente and all of this work’s been published, we have looked at what are the health impacts of those differences? And there’s significant impacts at this block level. In some cases, you have differences of eightfold within a single block, and those differences actually have a significant impact on health outcomes. In that case, what we found is with the heart implications for elderly were significantly impacted depending on where you lived. These data, again, creating transparency. So you can start to think about, where do I want to go running? Do I want to live here?
But even more importantly, what’s the source of why is it high over here and lower over there? Is it because you have a bad traffic light? Is it because you have a restaurant? Putting out a lot of fine particulates? What is it that’s driving it? You can target your mitigation directly to solve those problems.
Bill Loveless: Interesting. And you’re taking it now to a much higher level in terms of detection,
Steve Hamburg: No pun intended, right?
Bill Loveless: This launch is coming as the US Environmental Protection Agency and governments around the world are preparing regulations or implementing regulations addressing methane emissions. In case of EPA, the agency in December issued a final rule targeting methane emissions from oil and gas sector. And unique to this rule is EPAs creation of the so-called super emitter program for identifying and addressing significant methane leaks from production facilities. How does the EDF satellite fit in here? You mentioned before this is an important instrument for policymaking and regulation. How does the satellite fit in here?
Steve Hamburg: So we can provide the underlying data to track progress and do it spatially in a way that we couldn’t do with satellites up till now. And while the super emitter program is great, we have to remember that that only accounts for a minority of the missions that we’re going to see. The majority will not be within that. And we need to bring the emissions down dramatically so that we need to think of it as what’s the total emissions from an area? What’s the total emissions from the basin? What’s the total from the sub-basin? That’s exactly what MethaneSAT can provide. So we will be able to track the progress and understand what the emission rates are, which ones are clean, which areas are dirty relative to production in a way that you can’t do that. You could do that with aircraft in the United States because we can fly over it, and we’re going to do it routinely from space, but we also want to have comparable data for the United States to other regions. We can’t do that in other regions.
So we’ll be able to provide a common set of metrics and data for all the major basins around the world, including those across the United States. And then we have the data to really track this change and track how effective the policies are.
Bill Loveless: And of course, this is a matter of international trade as well, right? The European Union countries have advanced methane emissions, and their regs, as I understand it, are expected to impact global gas and LNG exports, including the US, now the world’s biggest LNG exporter. Again, will methane sat be a resource for implementing these types of regulations?
Steve Hamburg: Absolutely because we can determine. We will provide the base data to allow that to be done. So we’ll be able to… There’s discussion about a methane supply index. How much methane is coming from different sources of gas? And we will have all the data necessary to do that. And currently, that data is not available. You can kind of piece it together, but you have to make some estimates. And basically, people can tell you what they want and you can’t easily disprove them or confirm their data. That should all change. We will have transparency. We’ll be able to produce those data for every major basin, as I said, around the world. Some will take a little longer because we’ll be able to see it a less little less frequently, but ultimately, we’ll have a high integrity data for all these basins, which is something we’ve never had for oil and gas. We’ve never had it for any sector of any in the global economy, for any greenhouse gas in the past.
Bill Loveless: And of course, still one other major development lately has been the recent US climate meeting in Dubai. There was the global methane pledge sign there by more than 150 countries. They pledged to cut methane emissions by 30% from 2020 levels by the end of the decade. And that could have a significant impact on our attempts to hold the temperature down. How important is this venture to those efforts?
Steve Hamburg: Well, this is absolutely essential because that allows us… It’s an integral part of the tracking of progress. Now, some of the more diffuse sources, let’s say from agriculture, will be harder to see. So if you have animals and they’re spread over large areas, we won’t probably be able to see them. If we have concentrated animals or things like that, we will be able to see them, but we’ll have much better data to be able to track. And just to correct one small factual, so the global methane pledge was actually in the Glasgow COP, so that was two years ago. And then there was the oil and gas decarbonization charter where 52 companies signed up to reduce their emissions significantly to 0.2% of production or less, which we estimate to be somewhere between an 80 and 90% Reduction on average.
So it’s a dramatic reduction. And having these kinds of data for MethaneSAT is absolutely critical to those kinds of commitments. Because for the first time, we’ll be able to have independent third party data that directly looks at these commitments and can assess thumbs up, you’re doing it, you’re hitting those targets, or maybe not doing so well, or maybe you’re doing terribly. So we’ll have transparency. Again, driving change comes with high levels of transparency so we can really assess so you know, whether you’re buying LNG or you’re trying to make decisions as a country related to next steps on your decarbonization, you have high quality data, not estimated data, which is what we currently have. We’re using emission factors. And they’re not specific to your location, and they were collected multiple years ago, so they’re very slow to change.
So if you’re a good actor, you’re a company and you’re really doubling down, using that system, it won’t be reflected in your data for quite a long time, if ever. We want you to be rewarded right away. Look at them. They’re doing a great job. And those who are not, we want to be able to say that as well. The key is we want to race to the top. We want everyone to do better. And to do that, transparency, just shedding light on the situation is a really strong incentive to get higher performance.
Bill Loveless: Steve, you mentioned agriculture, and of course, that’s the single largest human driven source of methane. Will the satellite capture anything other than oil and gas infrastructure? What about other types of emissions like carbon dioxide or even hydrogen, or maybe those other sectors like agriculture?
Steve Hamburg: So we do actually see CO2, carbon dioxide. We haven’t talked about it a lot. And we will be looking at carbon dioxide to some degree, but we won’t have the capacity to make all the measurements we might want to make just in terms of… We are so data intensive with these sensors that are such high precision, we can only download so much data. And we will look… As I mentioned, we have a partnership with the New Zealand Space Agency, and they’re focused on agriculture, and they have a portion of our targets are dedicated to agriculture. The primary goal of the mission is oil and gas, but we have a very dedicated secondary mission to look at agriculture. So they will be setting targets around the world to look at agriculture to better understand emissions. Now, understanding agriculture emissions on a global scale is still earlier in our understanding than we are for oil and gas. So we have a lot to learn about what we can see and how it varies over time and space. So there’ll be a lot of data to just start to begin to understand those emissions.
But for the first time, we’ll have a remote sensing capacity to really start to map agricultural emissions, something we’ve not had up till now.
Bill Loveless: So you start with oil and gas. There’s a component there for agriculture that can grow, and perhaps there are other applications that could be instituted in the future.
Steve Hamburg: Yeah. So we will do some other locations, but again, we have only so much capacity with the satellite, and it’s a data downlink problem, right? It’s not a we could turn the satellite on more, but it’s a target mode. We have to turn it on. We’re going to look at this place, that place because it’s so data intensive. So we will look at other areas, but the bulk of the targeting will be oil and gas and ag, and then a bit of other things, intermix. Some of it’ll be developing CO2 data so we can really understand how this high precision and spatial resolution improves our understanding of CO2 emissions. So we are committed to doing that and testing some hypothesis relative to how useful would better CO2 data be in driving mitigation? And we hope to provide the data to answer that question, which then should be very useful for figuring out how future satellite missions could be designed most effectively.
Bill Loveless: Yeah, it’s such an exciting outlook for this whole entire project and all that convene for tracking these emissions. Have you packed your bags for the launch yet?
Steve Hamburg: I haven’t quite packed my bags, but we’re getting awfully close. And actually, I thought it would be a quiet period, but in fact, there’s just an unending number of things to address these days. So the team is enormously excited, and I can’t stress what a team effort, dozens. People building it at Ball Aerospace who’ve been a great partner, they’re one of the premier instrument satellite instrument makers in the world, have built the instrument. And Blue Canyon Technologies built the bus, the sort of operational side of it. And it’s all completed. It’s fully built, fully tested. And we’re going to take a pause and celebrate at the launch and recognize how far we’ve come, the notion that an NGO would take on such a ambitious project and succeed in building this amazing instrument, again, with lots of help, lots of people leaning in, and then the next day turn around and see how far we still have to go, how much data, because again, the measure of success is do we reduce those emissions.
We can have the world’s best satellite, we can have the best data processing system and still fail because we aren’t driving down emissions. And everybody on the team knows that. Everyone has to do their part and do it really well, but it’s only when everybody collectively does it, and we take that data to action pipeline and we fill it up with good data and it drives action, and we get mitigation and we get it quickly, then we succeed. And that’s the vision that everyone on the team, whether you are building a specific part of the satellite, whether you’re building a software, putting constructing software, whether you’re doing the advocacy, everybody understands that’s our measure of success, and it’s very much a collective effort.
Bill Loveless: Well, in fact, it is so exciting, and we’ll be watching. Good luck on the project, and thank you for taking the time at this particularly busy time for you as you approach the launch. Thank you for taking the time to discuss this project with us. Steve Hamburg, thanks for joining us on Columbia Energy Exchange.
Steve Hamburg: Thank you.
Bill Loveless: That’s it for this week’s episode of Columbia Energy Exchange. Thank you again, Steve Hamburg, and thank you for listening. This show is brought to you by the Center on Global Energy Policy at Columbia University of International and Public Affairs. The show is hosted by Jason Bordoff and me, Bill Loveless. The show is produced by Erin Hardick from Latitude Studios. Additional support from Robert Kleinberg, Lily Lee, Caroline Pitman, and Kyu Lee. Roy Campanella is the sound engineer. For more information about the show or the Center on Global Energy Policy, visit us online at energypolicy.columbia.edu, or follow us on social media @ColumbiaUEnergy. And you can rate the show on Apple or Spotify. You can also let us know what you think by leaving a review. And if you really like this episode, share it with a friend or a colleague. It helps us reach more listeners like yourself. We’ll be back next week with another conversation.