Everyone Wants in on Brazil’s Rare Earths
But is Brasília ready to meet the moment?
Get the latest as our experts share their insights on global energy policy.
The Center on Global Energy Policy is providing live updates on key developments related to the Iran crisis. Check back here for the latest.

Hear in-depth conversations with the world’s top energy and climate leaders from government, business, academia, and civil society.
Grid operators sit at the center of many of the biggest forces reshaping the global energy system. They’re navigating rising electricity demand, a lack of transmission infrastructure, shifting...

Insights from the Center on Global Energy Policy
This Energy Explained post represents the research and views of the author. It does not necessarily represent the views of the Center on Global Energy Policy. The piece may be subject to further revision. Contributions to SIPA for the benefit of CGEP are general use gifts, which gives the Center discretion in how it allocates these funds. Rare cases of sponsored projects are clearly indicated.
For a full list of financial supporters of the Center on Global Energy Policy at Columbia University SIPA, please visit our website at Our Partners. See below a list of members that are currently in CGEP’s Visionary Circle. This list is updated periodically.
The politically charged debate about investing based on environmental, social, and governance (ESG) principles has led to a fog of confusion about its merits and drawbacks.[1] Claims and counterclaims about ESG—often without supporting evidence—are obfuscating the reality. Two such claims are that ESG has impeded oil and gas firms’ access to capital and increased their cost of issuing debt.[2] At present, evidence of restricted access to financing for oil and gas companies due to financial institutions’ ESG considerations appears scant at best.[3] This post addresses the second claim regarding the cost of issuing debt for these companies: While ESG investing appears not to have hindered access to capital for oil and gas companies, could it have resulted in a higher borrowing cost for these firms? So far, evidence shows that the answer is no.
The economic recovery that followed the 2020 contraction combined with supply chain disruptions led to a sharp increase in inflation globally, which was worsened by jumps in fuel and food prices following Russia’s invasion of Ukraine last year. As a result, central banks around the world have been on a path of raising rates to address inflation, leading to globally higher costs of borrowing (i.e., higher bond yields) for all entities—sovereigns and corporations alike. Therefore, comparing the current yields of oil and gas companies with those in the past would not be meaningful, as it would show rising costs for all.
On the other hand, analyzing the bond yields of the oil and gas sector relative to a broad fixed-income market index would provide more useful information. If there was a widely followed index of oil and gas bonds, the ideal tactic would be to see if the spread (i.e., yield difference) of this index over a broad bond market index—for example, the Bloomberg Global Aggregate Index (Bloomberg Agg),[4] which is one of the most popular benchmarks for fixed-income investors—reflects any trends that can be attributed to the rise of investors’ ESG considerations. As it turns out, there are not too many oil and gas bond indexes—at least not used widely as benchmarks by investors—which somewhat complicates the analysis.
With no obvious index to use, the next best option is to construct an oil and gas companies’ bond index (OGBI) to analyze its spread. Creating an index is no trivial exercise as it involves following rules for inclusion and exclusion along with periodic rebalancing. With the purpose of drawing broad conclusions from the index while keeping the exercise as simple as possible, the metrics used to construct it were ratings, liquidity, duration, and diversification (see Table 1).
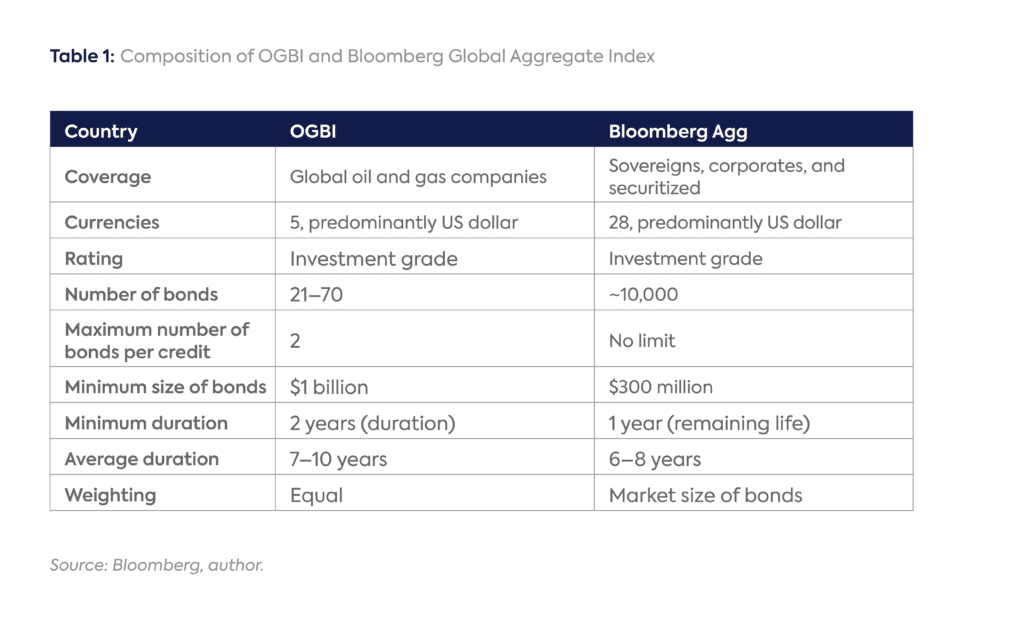
Because the duration of OGBI differs from that of Bloomberg Agg and the durations of both vary with time, the spread cannot be computed as a simple difference between the yields of the two. To correct for the slope of the yield curve attributable to the duration difference between the two indexes, the easiest approach is to first compute the spread of each index over a duration-matched US Treasury yield.[5] The difference between the spreads over the US yield curve of the two indexes (i.e., OGBI over Bloomberg Agg) is then a measure of the excess yield commanded by the oil and gas sector.
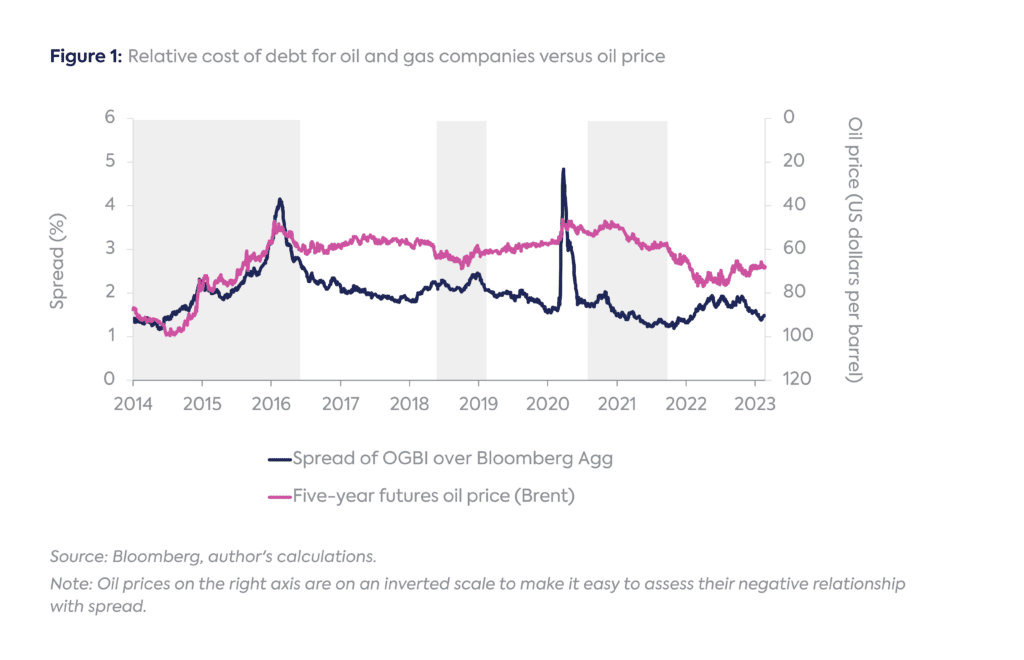
The spread of OGBI over Bloomberg Agg isolates risks related to the oil and gas sector, which should be related to oil prices. In general, one would expect a higher oil price to lead to a tighter spread—that is, better relative performance—of OGBI: all else equal, higher oil prices should increase the profitability of these companies, leading to improved creditworthiness in the eyes of investors. The spread should thus be expected to have a negative relationship with oil prices.
Plotting the spread against the five-year forward oil prices—as institutional investors tend to focus on the long-term outlook for oil rather than on its near-term gyrations—shows that oil prices and the spread, as expected, exhibited a negative relationship from 2014 to mid-2016, mid-2018 to early 2019, and from mid-2020 to late 2021 (shaded areas in Figure 1). At other times, though, the relationship between the two is either indeterminate or sometimes even reversed. Almost certainly, other drivers are at play as well.
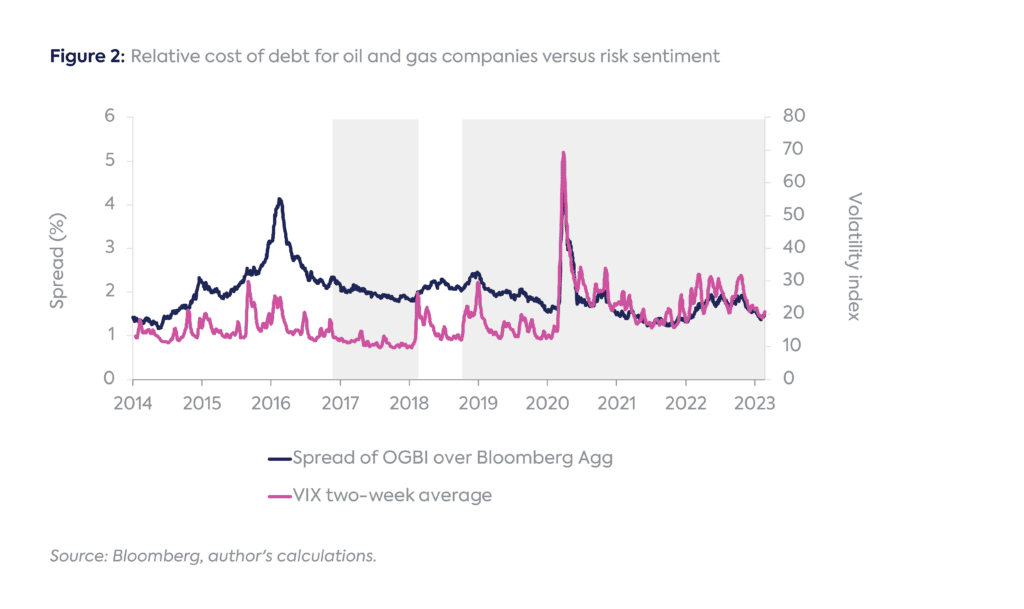
One such driver is the overall market risk sentiment. Since OGBI is a risk asset (i.e., it trades at a yield higher than risk-free rates), one would expect its demand to have a positive relationship with risk appetite. Using a broad market volatility index (VIX) as a proxy for risk sentiment (more accurately, its two-week average to reduce the noise in daily data; the lower the risk appetite, the higher the market volatility, typically) shows that the OGBI spread moved more or less in line with changes in risk tolerance between mid-2016 and 2017 and has since late 2018 (shaded areas in Figure 2).
If investing based on ESG criteria had a damaging impact on the cost of issuing debt for oil and gas companies, one would expect to see their spread increase with time as the share of ESG-integrated funds has been growing rapidly within the total assets under management (AUM). However, the spread of investment-grade oil and gas companies over the Bloomberg Agg has remained in a relatively narrow range of 1.2–2.5 percent since 2017, with no specific trend (barring a brief spike during the second quarter of 2020, when economic uncertainty due to the pandemic was at its worst). Moreover, the current spread of 1.5 percent is close to the low end of the range.
Almost all of the spread movements of OGBI appear to be a function of oil price and/or risk sentiment. In particular, since mid-2020, trends in the spread have closely mirrored shifts in risk sentiment. This period is critical since it overlaps with the spectacular growth of funds incorporating ESG criteria, with assets under management in the US reaching $8.4 trillion in 2022.[6] If there were an impact from ESG, it would have been felt during this period.
Instead, changes in the assets of ESG fixed-income exchange-traded funds (ETFs)—which should be representative of the full universe of such funds since they are a microcosm of it—have had an inverse relationship with the OGBI spread at least since 2018 (Figure 3). For example, the sharp increase in ESG fixed-income ETF assets in early 2021 and late 2022 coincided with the OGBI spread tightening!

Considering trends in risk sentiment and ESG AUM, it appears that both ESG assets and the OGBI spread have been reacting to shifts in risk sentiment since late 2018. This implies that ESG is playing no discernible role in influencing the debt cost of oil and gas companies.
Can this relationship change in the future as funds integrating ESG criteria continue to grow? It’s possible, but investors are well aware of the expected growth of ESG funds and their potential impact on investments in oil and gas companies. If increasing ESG funds were a concern for the market, it would already have been priced in long-term yields. With the average remaining life of OGBI of over 10 years, its yields would already be reflecting this concern, but there is no evidence of it.
The only way to cut through the noise in hot-button debates—like the one on ESG—is by supporting or debunking claims with analysis. This post offers one such investigation and finds that current evidence indicates that the growth of assets under management of funds with ESG mandates is not raising the cost of debt for investment-grade oil and gas companies. ESG factors could be playing a greater role in high-yield companies, which by definition are weaker credits and are therefore vulnerable to added risks. Exploring the debt costs of these companies could help gain a fuller picture of the impact of ESG. Regardless, based on the estimate that roughly 70 percent of the outstanding debt of oil and gas companies is investment grade, the evidence so far shows that ESG is not materially impacting the cost of issuing debt for these firms.
CGEP’s Visionary Circle
Corporate Partnerships
Occidental Petroleum Corporation
Tellurian Inc
Foundations and Individual Donors
Anonymous
Anonymous
the bedari collective
Jay Bernstein
Breakthrough Energy LLC
Children’s Investment Fund Foundation (CIFF)
Arjun Murti
Ray Rothrock
Kimberly and Scott Sheffield
[1] Patrick Temple-West and Brooke Masters, “Wall Street Titans Confront ESG Backlash as New Financial Risk,” The Financial Times, March 1, 2023, https://www.ft.com/content/f5fe15f8-3703-4df9-b203-b5d1dd01e3bc.
[2] Shivaram Rajgopal, “ESG – A Defense, A Critique, And A Way Forward: An Evidence-Driven Pragmatic Perspective,” Forbes, August 21, 2022, https://www.forbes.com/sites/shivaramrajgopal/2022/08/21/esg–a-defense-a-critique-and-a-way-forward-an-evidence-driven-pragmatic-perspective/?sh=25de10956bc1.
[3] Gautam Jain and Luisa Palacios, “Investing in Oil and Gas Transition Assets En Route to Net Zero,” Center on Global Energy Policy, Columbia University, March 2, 2023, https://www.energypolicy.columbia.edu/publications/investing-in-oil-and-gas-transition-assets-en-route-to-net-zero/.
[4] Bloomberg Professional Services, Bloomberg Fixed Income Indices Fact Sheets and Publications, https://www.bloomberg.com/professional/product/indices/bloomberg-fixed-income-indices-fact-sheets-publications/.
[5] To derive the duration-matched US yield, the US yield versus duration curve was fitted using the Nelson-Siegel-Svensson model. For a detailed explanation of this approach, see Gautam Jain, “Thematic Bonds: Financing Net-Zero Transition in Emerging Market and Developing Economies,” Center on Global Energy Policy, Columbia University, December 2022, https://www.energypolicy.columbia.edu/publications/thematic-bonds-financing-net-zero-transition-emerging-market-and-developing-economies/.
[6] US SIF, “2022 Report on US Sustainable Investment Trends,” December 2022, https://www.ussif.org//Files/Trends/2022/Trends%202022%20Executive%20Summary.pdf.
The World Bank is revisiting one of its most entrenched positions, publicly questioning its long-standing emphasis on market-led approaches in economic policy.

The US blockade of tankers serving Iran's oil exports is intended to cut Iranian oil exports to near-zero.

Iran has expanded its storage infrastructure over the past decade to levels that may be sufficient to handle up to two or three weeks of crude exports at pre-war levels.

Europe is entering the 2026 gas injection season with its lowest level of gas in storage since 2018.
Project-based carbon credit markets (PCCMs) facilitate the generation, trading, and retirement of carbon credits from projects that remove, reduce, or avoid greenhouse gas emissions.