This report represents the research and views of the author. It does not necessarily represent the views of the Center on Global Energy Policy. The piece may be subject to further revision. Contributions to SIPA for the benefit of CGEP are general use gifts, which gives the Center discretion in how it allocates these funds. More information is available at https://energypolicy.columbia.edu/about/partners. Rare cases of sponsored projects are clearly indicated.
For a full list of financial supporters of the Center on Global Energy Policy at Columbia University SIPA, please visit our website at https://www.energypolicy.columbia.edu/partners. See below a list of members that are currently in CGEP’s Visionary Annual Circle.
This list is updated periodically.
Air Products
Anonymous
Jay Bernstein
Breakthrough Energy LLC
Children’s Investment Fund Foundation (CIFF)
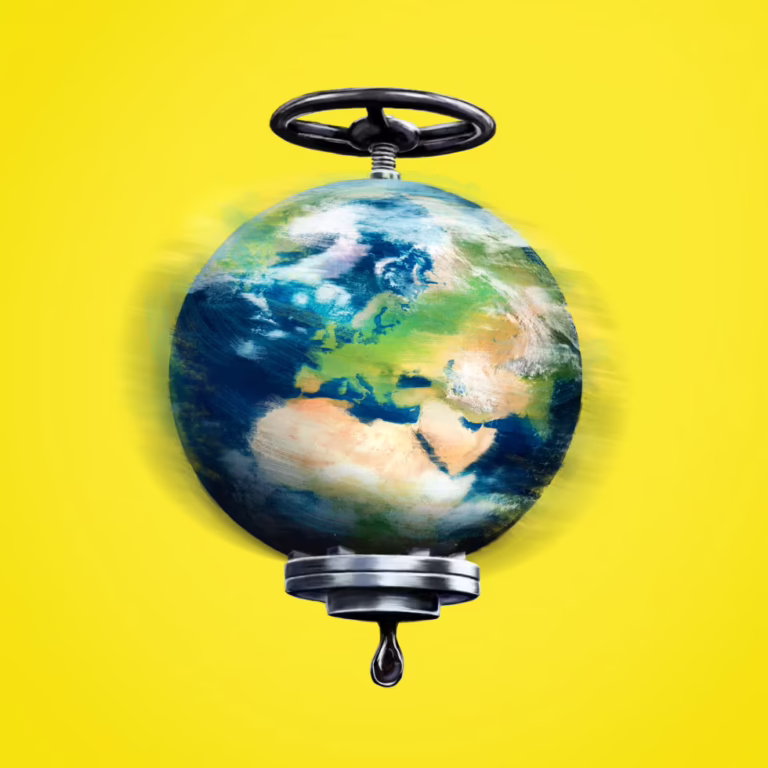
State-owned enterprises (SOEs) play a major role in the production of goods and services across many of the world’s largest economies, particularly in electricity generation, oil and gas, and heavy industry. SOEs (defined in this report as companies for which 50 percent or more of voting shares are held by a government) are also major sources of greenhouse gas emissions.
The governments that control these SOEs are also signatories to the Paris Agreement on climate change. State ownership provides these governments with a major direct point of control over the climate and energy outcomes of these companies, both in terms of reducing emissions and directing future investment into low-carbon technologies and infrastructure. Improving the measurement of SOEs’ contribution to both national and global-level emissions provides important information to help understand to what extent SOEs should be targeted and to design strategies to maximize their potential role in the broader energy transition.
This report provides an accounting of direct emissions associated with SOEs globally. It is challenging to comprehensively identify every SOE, as the total is estimated at well over 100,000. In addition, most identified SOEs do not disclose their emissions nor are estimates of these emissions available in the public domain. Despite these limitations, data compiled for this report covering almost 300 major SOEs suggest that SOEs globally are responsible for at least 7.49 gigatons of carbon dioxide equivalent (GtCO2e) annually in direct (Scope 1) emissions. While the true scale of SOE-related emissions is likely to be substantially higher, particularly when accounting for national oil companies and iron and steel manufacturers that do not currently report their emissions, this figure is over 1 GtCO2e greater than various previous estimates, and larger than the total annual emissions of any country except China.
Additional findings from this report include the following:
In many of the world’s largest economies, including several that are growing rapidly, the state itself owns sizable companies in sectors of strategic importance to its development and energy security. The sectors in which government ownership is most prominent include power generation, industrial production, and oil and gas, although national governments are also present as shareholders in the airline, agriculture, and public transport industries. These state-owned enterprises (SOEs) tend to be emissions intensive, based largely on the production or consumption of hydrocarbons. SOEs are defined in this report as companies for which 50 percent or more of voting shares are held by a government, either directly or through one or more state-owned entities, such as sovereign wealth funds.[1]
The governments that control these SOEs are also signatories to the Paris Agreement on climate change. State ownership provides these governments with a major direct point of control over the operations and strategy, and therefore the emissions footprints, of these firms. Improving the measurement of SOEs’ role in the decarbonization process and crafting policies designed to maximize their decarbonization potential could support the broader energy transition.
This report seeks to provide an accounting of direct emissions associated with SOEs globally. This can help to provide a more complete picture of how SOE emissions are distributed across countries and sectors and can illuminate where governments might most effectively apply pressure in pushing or pulling their SOEs toward achieving climate and green development objectives. The authors then consider future expansion of the inventory into other sources of public sector emissions as well as the potential for the inclusion of investments in low- or zero-emissions assets in a holistic accounting of SOEs’ climate-related activity.
SOEs are major economic players. The Organisation for Economic Co-operation and Development (OECD) finds that SOEs represent over 10 percent of the world’s 2,000 largest public companies, with sales of $3.6 trillion in 2011.[2] This is larger than every national economy in the world today other than those of the United States, China, Japan, and Germany. A subsequent study of 34 countries, 30 of which are OECD members, identified 2,111 SOEs with an estimated market value of $2 trillion and with 6 million employees.[3] The International Monetary Fund estimates that China alone may have up to 150,000 SOEs, including 50,000 centrally owned SOEs and 100,000 local SOEs, in addition to 110 large conglomerates under the direct supervision of the State-Owned Assets Supervision and Administration Commission.[4] While state ownership of key industrial sectors is prevalent in emerging and developing economies (China, Indonesia, Mexico, and Saudi Arabia, for instance), large government-controlled companies are also present in advanced economies (notably in power and urban transit), including those of Canada, France, and the Republic of Korea (South Korea).
SOEs play major roles in high-emitting, energy-intensive sectors, including power generation, steel and cement manufacturing, air transport, and public transport. A 2019 estimate of SOE greenhouse gas emissions found that they emit at least 6.2 gigatons (billion tons) of carbon dioxide equivalent (GtCO2e) annually, which, for perspective, is more than any single country except China.[5]
The national-level government owners of SOEs are also signatories to the Paris Agreement on climate change.[6] Under the agreement, governments commit themselves to holding the rise in global temperature to “well below” 2oC above preindustrial levels, with an aspirational target of 1.5oC.[7] As of December 2021, over 130 countries have either proposed or legislated for economy-wide net-zero emissions targets, including Canada (2050), the European Union (2050), Japan (2050), South Korea (2050), the United Kingdom (2050), the United States (2050), China (2060), Indonesia (2060), and India (2070).
Achieving these goals will require rapidly reducing, and then virtually eliminating, national emissions, including from the SOEs generating significant shares of those emissions. In their roles as sole or majority shareholders of SOEs, governments may be able to exercise considerable, if not dominant, influence over the climate strategies and policies of SOEs. Their ability to do so is strongly determined by the local political-economic context defining how a government and its SOEs interact and also by the legal status of the SOE and the constraints within which it operates, which include but are not limited to fiduciary duties, obligations to pursue financial returns, and constraints on capital investments.
Policies, legislation, and institutions also govern the activities of private companies and individuals but in a less direct and targeted manner than is typically available to governments in influencing the actions of their own SOEs. In addition, market-based policies designed to change the behavior of profit-maximizing firms may have a more muted effect on SOEs, in part because SOEs are often expected to meet socioeconomic targets rather than simply maximize profits. Examples of such targets include contributing to national economic growth, ensuring secure supplies of key goods and services, and generating employment.[8]
Emissions disclosures by the universe of publicly traded companies (both state-owned and private) are incomplete, being almost exclusively voluntary. For SOEs, the lack of emissions data is even more severe. Some SOEs are owned wholly and directly by the government, while for others the government holds a majority or near-majority share and other financial SOEs (e.g., public pension funds, social security funds, or public investment funds) hold smaller shares—with the remainder floated on the stock market or held by private investors. Among those SOEs that are publicly listed—only one-third of the 2,000-plus firms in the 34-country OECD study[9]—some disclose their emissions. Among the unlisted majority, very few do, and reported figures can be difficult to verify. Previous attempts to quantify emissions have been limited to the small number of large companies for which such data is readily available.[10]
The inventory compiled in this report draws from a broad range of sources to gather company-specific figures for almost 300 SOEs across the globe to estimate carbon dioxide equivalent emissions on national and sectoral levels. The methodology used in making these calculations is presented in Appendix I (with a summary presented in Box 1). Details on the SOEs with the highest disclosed emissions are listed in Appendix II.
Box 1: Methodology Summary (see Appendix I for details)
The analysis in this report reflects Scope 1 emissions data reported directly by SOEs (outside of China’s power sector, for which data was gathered differently, as explained below) in financial or sustainability reports or other public documents (45 companies), as well as data reported by third parties: Arabesque S-Ray and Carbon Dioxide Management in Power Generation (CARMA) via the International Energy Agency (IEA) (240 companies). Public transit emissions are obtained from a variety of additional sources listed in Appendix I. Only parent company emissions are counted in cases where subsidiaries are also SOEs to avoid double counting, and when multiple governments are shareholders, the SOE is associated with the country in which it is headquartered. Emissions from these sources total 2.78 GtCO2e.
Chinese coal power emissions are estimated using a top-down approach based on total coal power generation emissions of 4.9 GtCO2e in 2019, scaled by the estimated 94 percent share of state ownership in national coal power generation capacity. This results in estimated SOE emissions from Chinese coal power of 4.61 GtCO2e. A similar approach is used to estimate SOE emissions from the Chinese gas power sector (74 percent of 0.13 GtCO2e), resulting in 0.09 GtCO2e. Total power sector SOE emissions in China are therefore estimated at 4.7 GtCO2e annually.
The total direct emissions identified and analyzed in this report are the sum of these two figures, 7.49 GtCO2e per year. (Adding emissions derived from production and emissions intensity estimates in cases where there is no reported data—a methodology not employed in this paper’s total figure because it is less robust than using reported amounts—would raise the total SOE emissions to 8.87 GtCO2e per year [see Appendix I].)
Box 1: Methodology Summary (see Appendix I for details)
The detailed inventory of direct emissions[11] by SOEs used in this report estimates that SOEs emit at least 7.49 GtCO2e annually, based on the most recently reported year. This figure is greater than the emissions of any single country except China and makes up over 16 percent of the 2017 global total.[12] The figure is also over 1 GtCO2e per year greater than the 6.2 GtCO2e estimate previously reported by one of the authors of this report,[13] resulting from a more detailed and extensive inventory of companies.
Geographically, SOE emissions are highly concentrated in entities controlled by governments in China (69 percent share, 5.16 GtCO2e), as shown in Figure 1. This is followed by Russia and India (4 percent each); Indonesia, South Africa, and South Korea (3 percent each); and Saudi Arabia and Mexico (2 percent each). Most of the remaining emissions are linked to SOEs domiciled in Taiwan, Sweden, the United States, Brazil, and Poland (1 percent each), with the remaining 6 percent distributed across 20 other countries.
Figure 1: Direct SOE emissions by country of ownership (GtCO2e/year)
Although this inventory is incomplete due to the absence of emissions data for the majority of SOEs identified in the database, the dominant contribution of Chinese SOEs to direct emissions is clearly visible. China’s SOEs are responsible for over three-quarters of total direct emissions, largely from coal-fired electricity generation. Of the 58 SOEs with direct emissions of over 10 million tons (Mt) of CO2e annually (as reported either by companies or third parties), more than one-quarter are Chinese SOEs in the power, oil and gas, and cement sectors (see Appendix II). This finding is unsurprising given China’s contribution to global emissions and the centrality of SOEs across most of the country’s industrial sectors.
SOEs from large developing economies comprise much of the remaining emissions. Notably, three of the four remaining BRICS (Brazil, Russia, India, China, and South Africa) economies rank in the top 15 emitters, representing 12 percent of the total and 37 percent of non-Chinese emissions. Post–Soviet Russia, the largest share after China, retains state control over a number of entities in the power and oil and gas sectors (e.g., Gazprom, Rosneft, and Inter RAO). India represents the next-largest share; its partly privatized power and industrial sectors still include large SOEs (e.g., NTPC Ltd). South Africa’s power sector emissions are overwhelmingly attributable to its state-run utility, Eskom. The last of the BRICS economies, Brazil, makes a significantly lower contribution at 1 percent of the total, partly due to the steady privatization of emissions-intensive industries and the relatively high proportion of hydroelectric and renewable power in its electricity grid.
Economies hosting individual SOEs with reported emissions of over 10 MtCO2e annually are summarized in Table 1 (see Appendix II for greater detail on specific emissions figures, sources, and reporting years for each SOE). While China is home to by far the largest number of high-emitting SOEs, a significant number are located in upper-middle and high-income countries, with the only lower-middle income countries on the list being India and Indonesia. A fuller accounting of direct emissions from national oil companies (NOCs) and steel and cement SOEs, both of which are underrepresented, would add to this list.
Table 1: Economies hosting SOEs with annual emissions exceeding 10 MtCO2e/year (most recently reported)
It is important to note that emissions under this inventory are allocated to countries according to the country to which the SOE belongs, in full or in part. Although some individual SOEs may record emissions from operations abroad, most SOE emissions are largely domestic and are consequently a good estimate for national emissions from each country’s SOEs, with some exceptions. [15]
The power sector makes up 85 percent of the direct SOE emissions identified in this inventory (see Figure 2), at 6.4 GtCO2e, followed by oil and gas[16] at 10 percent (0.78 Gt), transport at 1.8 percent (0.14 Gt), cement at 1.4 percent (0.11 Gt), and chemicals at 0.6 percent (0.05 Gt). As noted above, emissions from oil and gas are likely to be heavily underestimated due to the lack of disclosure by SOEs in both sectors. There is no disclosed emissions data available for SOEs in the iron and steel sectors.
Figure 2: Direct SOE emissions by sector (GtCO2e/year)
In power generation, Chinese SOEs, heavily reliant on coal, make up three-quarters of the sector’s global contribution. The “’Big Five” Chinese power generators (Huadian [including subsidiary Huadian Power International], Huaneng, Datang, CEIC, and SPIC) alone make up over 20 percent of estimated global SOE emissions across all sectors. India, Indonesia, South Korea, Mexico, South Africa, Saudi Arabia, Russia, Taiwan, Sweden, and the United States comprise much of the remainder—all of which, except Sweden, rely heavily on fossil fuels (coal, gas, and oil) for electricity generation.
The measurement of oil and gas emissions presents particular challenges not only because of incomplete and inconsistent reporting by NOCs but also because of the uncertainties and measurement challenges inherent in methane emissions estimates, which generate a significant proportion of total greenhouse gas emissions in the sector.[17] Consequently, the figures in this report for direct oil and gas emissions from NOCs are incomplete and require further analysis. Moreover, NOCs, as well as state-owned coal mining companies, produce a significant portion of the world’s fossil fuels and have correspondingly large Scope 3 emissions from the combustion of these fuels. They therefore play a significant role in total global emissions across multiple sectors.
The two sectors contributing over 1 percent of nonpower direct emissions are cement and transport. Both are high-emitting sectors, but they at least partly externalize their operating emissions to the power sector through the consumption of fossil-fueled electricity. The transport figure primarily covers state-owned airlines and public transport systems. As noted above, the authors were unable to locate emissions disclosures by state-owned iron and steel producers (see Appendix I for a possible approach to deriving these unreported emissions).
In many countries, SOE emissions constitute a significant portion of national emissions.[18] For these countries, achieving their emissions reduction targets will require SOEs to be major instruments of climate action.
China’s SOEs, for example, generate about half of the country’s total greenhouse gas emissions.[19] In addition, China’s national oil and gas companies and large state-owned coal mines supply a significant portion of its domestically consumed fossil fuels.[20] The implication is that SOEs control value chains for sectors responsible, directly or indirectly, for the majority of China’s emissions: coal, electricity, oil, and gas. Consequently, any major steps toward China’s goal of carbon neutrality by 2060 will require addressing emissions generated by the country’s SOEs.
Other countries in which SOEs contribute significantly to national emissions include India, Indonesia, Mexico, Saudi Arabia, South Africa, and South Korea. If these countries are to achieve their Nationally Determined Contributions to the Paris Agreement, SOE climate action is imperative.
Moreover, SOEs are frequently responsible for providing a significant share of low- and zero-carbon electricity, even in countries where they also operate a large proportion of the fossil-fired fleet. China’s SPIC, for example, operated a 165 GW portfolio in 2020, 47 percent of which was coal-fired capacity.[21] It is also considered the world’s largest generator of renewable power from solar and wind installations, with 12 GW and 14 GW, respectively, in installed capacity in 2020, as well as 22 GW of hydroelectric capacity.[22] The contribution of SOEs to low-carbon generation is particularly evident in strategically significant, capital-intensive, and sometimes politically controversial infrastructure projects such as large-scale hydroelectric dams and nuclear power plants. In France, for example, the low carbon intensity of its electricity sector is largely the result of the nuclear power plant fleet owned by its power sector SOE, EDF. Similarly, as other countries look to expand low-carbon-generation alternatives (including nuclear power), SOEs will play an important role in the effort and, consequently, in delivering on national emissions reduction pledges.
The SOE emissions accounting exercise conducted in the preparation of this report uncovered a significant amount of emissions for which the state has ultimate responsibility, but the picture is incomplete. In addition to difficulties in identifying SOEs and obtaining information on their emissions, there are emissions under public sector control that fall outside the coverage of this report.
This analysis has focused on clearly identifiable industrial sectors where state ownership can be relatively easily ascertained and, within these sectors, on corporate institutional structures. Oil and gas, as previously mentioned, is an area that merits further close analysis, including of methane emissions from NOCs. Another is the agricultural sector where more research is required, particularly for methane as well as other non-CO2 greenhouse gas emissions.
There are, importantly, other sectors/activities with assets managed by noncorporate institutions that are controlled by the government and that potentially generate significant emissions. One example is public buildings, for which data are typically reported only in aggregate through city-level or national inventories.
Another case of government-owned assets generating emissions outside corporate structures is the military sector, which contributes to emissions through both oil (particularly jet fuel) and electricity consumption. Brown University research suggests the United States military emits 59 MtCO2e annually (predominantly direct Scope 1 emissions) and has emitted well over 1 GtCO2e since 2001.[23] The same analysis estimated that emissions from the military industry meeting United States military demand approximate 153 MtCO2e annually. Emissions from air force, army, and navy operations disclosed by the Defense Logistics Agency totaled 23.3 MtCO2e in 2017.[24] This disclosure alone would place the US military in the top 50 state-owned emitters. Further studies suggest annual military emissions for the United Kingdom, including arms sales, total 11 MtCO2e annually,[25] and those of the European Union total almost 25 MtCO2e annually.[26] Based on these figures, the authors conservatively estimated that direct military emissions on a global scale are likely to significantly exceed 100 MtCO2e.
While SOEs and the public sector are responsible for large sources of emissions and power sector SOEs continue to invest heavily in coal, they are also—as indicated previously—major direct investors in low-carbon technologies.[27] In nominal terms, SOE investments in fossil and non-hydro renewables were approximately equal in 2015. OECD research shows that while SOEs in the power sector own well over half the world’s fossil fuel generation capacity, they also control about 75 percent of hydro and nuclear capacity.[28] These energy sources produce very low-emissions electricity relative to fossil fuel-fired alternatives, helping to displace emissions that would otherwise occur.
The promotion of low-carbon generation is sometimes characterized by the emissions it avoids[29]—or “nega-emissions,” similar to the concept of “negawatts,” [30] which is used to measure the avoided power generation yielded by energy efficiency investments. The inventory presented in this report could in principle be extended to include complementary information on the amount of “avoided emissions” generated by SOEs, including renewable and other low-carbon capacity investments, as well as investments in energy efficiency and electrification measures that are prerequisites for decarbonization in nonpower sectors.
To the extent possible, this analysis has minimized double counting of emissions by restricting aggregate figures to Scope 1 emissions. However, the purpose of this inventory is not just to aggregate direct emissions in each sector but also to understand where the key leverage points for governments are in using their SOEs to meet climate policy objectives—even where the supply chains, hence the emissions footprints, of these SOEs overlap. Understanding the combination of Scope 1, 2, and 3 emissions, as well as avoided emissions, under state control would provide a fuller picture of the potential latitude for climate action by governments.
Direct emissions under government control through majority-state-owned companies total at least 7.49 GtCO2e[31] annually. For perspective, this equates to more than any single country’s Scope 1 emissions except China’s. Limited disclosure in several major sectors suggests the real total is considerably higher. The majority owners of these companies are governments that are also signatories to the Paris Agreement, making their management and direction of these companies (in their shareholding and policy-making roles) critical for meeting their net-zero emissions targets. The purpose of this analysis has been to take initial steps toward addressing the lack of comprehensive aggregate data on emissions associated with state-owned entities.
By elucidating the distribution and size of state-controlled sources of emissions, this preliminary analysis can support governments in using their SOEs as a tool for achieving climate policy objectives. It can also assist nongovernmental actors in holding their governments to account for the emissions under states’ control in their role as majority shareholders of high-emitting entities. Expanding the research to map emissions controlled by governments outside SOEs (e.g., from public sector buildings and the military) and the potential of government-controlled entities to pivot to low-carbon alternatives across multiple sectors could provide further insight into the role that government owners can play in advancing the low-carbon transition.
While some SOEs are listed companies and more likely to disclose their emissions (and are increasingly doing so as sustainability rules in stock markets and regulatory disclosure requirements become more prevalent), many are not, and obtaining information of any kind for these companies is extremely challenging.
In this report, only direct (Scope 1) emissions are counted in the total figure for SOEs to avoid any double counting of emissions associated with electricity consumption. This is particularly relevant when companies in both the power sector and industrial sector that consume large amounts of electricity are state owned.
The following data points were collected in identifying and assessing SOEs:
Once the combined adjustments for coal- and gas-fired power generation in China were included, and reported emissions for Chinese power sector SOEs removed to avoid double counting, the total direct emissions were 7.49 GtCO2e (5.01 – 2.23 + 4.61 + 0.09).
The inventory described in this report primarily uses publicly available information (in some cases preaggregated by third parties) to construct a list of 3,826 SOEs and associate them with sector, country, and emissions information where available. Of this larger amount, reports from 285 companies were identified, including many of the larger SOEs. The most recent emissions data was used in all cases, although differences in the availability of sources mean the most recently reported year ranges from 2009 to 2020. The ability to identify SOEs and the availability of emissions data for them varies considerably across sectors (see Table A1).
Table A1: Coverage by sector and emissions
In some cases, it was possible to estimate emissions in industrial sectors based on production and emissions intensity figures. In many more, this was not possible and further efforts will be needed to source and verify information on nondisclosing SOEs (including by accessing documents written in languages other than English).
These “derived” emissions, which were calculated as part of a broader inventory exercise, were not included in the total figure presented in this paper since they are less robust than reported emissions and were generated using a different methodology. In the continued absence of emissions reporting, though, this approach can be used in future work to infer some portion of missing emissions by applying emissions coefficients (typically available at the country level) to production data in the oil and gas, iron and steel, and cement sectors. The sources used for constructing derived emissions but that were not included as part of the analysis of this paper are listed in Table A2.
Table A2: Sources for production and emissions intensity estimates for select sectors
Table A3 shows how additional sector-level emissions could be found by applying this approach. Adding derived emissions would raise total estimated SOE emissions to 8.87 GtCO2e per year (the sum of inventoried SOE emissions of approximately 7.49 GtCO2e and derived emissions of approximately 1.39 GtCO2e, rounded).
Table A3: Additional emissions obtained when deriving from production and emissions intensity figures (GtCO2e/year)
A list of entities with annual emissions exceeding 10 MtCO2e reported (either directly or by third parties) is presented in Table A4. This list does not include many major NOCs and other companies (particularly in the iron and steel and cement sectors) for which reported emissions data were not available.
Table A4: Emissions reported for SOEs generating over 10 MtCO2e (Scope 1) annually
[1] In practice, governments can exercise de jure or de facto control over firms with less than 50 percent ownership, with the degree of control subject to the political, economic, and legal environment in which the firm operates. Given that each case is context specific, we use 50 percent as a conservative threshold in this analysis.
[2] This is the most recent such study available and is reported in Przemyslaw Kowalski, Max Büge, Monika Sztajerowska, and Matias Egeland, “State-Owned Enterprises: Trade Effects and Policy Implications,” OECD Trade Policy Papers, no. 147 (2013), https://doi.org/10.1787/18166873.
[3] OECD, The Size and Sectoral Distribution of SOEs in OECD and Partner Countries (Paris: OECD Publishing, 2017).
[4] W. Raphael Lam and Alfred Schipke, “State-Owned Enterprise Reform,” in Modernizing China: Investing in Soft Infrastructure, eds. W. Raphael Lam, Markus Rodlauer, and Alfred Schipke (Washington, DC: International Monetary Fund, 2017).
[5] Philippe Benoit, “Engaging State-Owned Enterprises in Climate Action,” Center on Global Energy Policy, Columbia University, 2019, https://energypolicy.columbia.edu/research/report/engaging-state-owned-enterprises-climate-action.
[6] For a list of signatories to and ratifications of the Paris Agreement, see the following: https://treaties.un.org/Pages/ViewDetails.aspx?src=TREATY&mtdsg_no=XXVII-7-d&chapter=27&clang=_en.
[7] United Nations Framework Convention on Climate Change, Adoption of the Paris Agreement (Paris: 2015).
[8] Benoit, “Engaging State-Owned Enterprises.”
[9] OECD, The Size and Sectoral Distribution.
[10] Liwayway Adkins et al., Energy, Climate Change and Environment: 2016 Insights (Paris: OECD/IEA, 2016).
[11] “Direct emissions” in this report means Scope 1 emissions as defined under the Greenhouse Gas Protocol. Scope 1 refers to direct greenhouse gas emissions from company facilities and vehicles. Scope 2 emissions refer to indirect emissions embodied in the energy used by the company (electricity, heating, and cooling) that is generated off site by energy suppliers (e.g., emissions associated with electricity purchased from a separate power utility). Scope 3 emissions encompass all other sources of emissions associated with company activities, including employee travel, operational waste, transportation and distribution, emissions from the use of products sold, and emissions from other goods and services purchased.
[12] SOEs contributed the equivalent of 17.5 percent of global 2017 emissions in CO2e, excluding land use change and forestry or 16.3 percent if including them. ClimateWatch, “Historical GHG Emissions,” 2020, https://www.climatewatchdata.org/ghg-emissions.
[13] Philippe Benoit, “State-Owned Enterprises: No Climate Success without Them,” Journal of International Affairs 73, no. 1 (2019), https://www.jstor.org/stable/10.2307/26872783.
[14] While the generation profile of EDF (Electricité de France) within France is almost exclusively from low-carbon nuclear and hydroelectric plants, its significant emissions footprint stems from its foreign installed capacity, which includes (as of 2020) 12 GW of gas capacity, 3.6 GW of oil capacity, and 3.7 GW of coal capacity. EDF, 2020 Annual Results: Appendices (Paris: EDF, 2021), 131, https://www.edf.fr/sites/default/files/contrib/groupe-edf/espaces-dedies/espace-finance-en/financial-information/publications/financial-results/2020-annual-results/pdf/annual-results-2020-appendices-20210304.pdf.
[15] Sweden’s SOE emissions primarily reflect those from Vattenfall, which owns power generation assets in several countries other than Sweden. Consequently, Vattenfall’s direct emissions are approximately twice those of Sweden’s power sector. In China’s case, while the majority of SOE emissions are domestic, the magnitude of these emissions means that even a small percentage of emissions from foreign operations can be significant. “Big Five” state-owned generator State Power Investment Corporation (SPIC), for example, has investments in over 10 GW of power generation assets and a range of other services across 41 countries.
[16] Note that this is Scope 1 emissions only. It does not include Scope 2 emissions associated with energy and electricity consumption, nor indirect Scope 3 emissions associated with the consumption of products. See endnote 11 for further details.
[17] For a breakdown of greenhouse gas emissions by type from oil and gas production, see Figure 11.8 in International Energy Agency, World Energy Outlook 2018, (Paris: 2018), 491.
[18] ClimateWatch, “Historical GHG Emissions.”
[19] China’s national emissions totaled 11.78 GTCO2e in 2017. ClimateWatch, “Historical GHG Emissions.”
[20] Erica Downs, “Green Giants? China’s National Oil Companies Prepare for the Energy Transition,” Center on Global Energy Policy, Columbia University, 2021, https://www.energypolicy.columbia.edu/research/report/green-giants-china-s-national-oil-companies-prepare-energy-transition.
[21] Reuters, “China’s SPIC Aims to Cap Domestic Carbon Emissions by 2023,” 2020, https://www.reuters.com/article/china-spic-climatechange-idUSL4N2IQ0R4.
[22] Energy Iceberg, “All You Need to Know about the Chinese Power Companies,” 2019, last accessed September 17, 2020, https://energyiceberg.com/state-owned-power-utilities/.
[23] Neta C. Crawford, “Pentagon Fuel Use, Climate Change, and the Costs of War,” Watson Institute, Brown University, 2019.
[24] Oliver Belcher, Patrick Bigger, Ben Neimark, and Cara Kennelly, “Hidden Carbon Costs of the ‘Everywhere War’: Logistics, Geopolitical Ecology, and the Carbon Boot‐Print of the US Military,” Transactions of the Institute of British Geographers 45, no. 1 (2020), https://doi.org/10.1111/tran.12319. The US Department of Defense reported 7 MTCO2e in additional Scope 3 emissions in 2016. See Crawford, “Pentagon Fuel Use.”
[25] Stuart Parkinson, The Environmental Impacts of the UK Military Sector (Halton, Lancaster, UK: Scientists for Global Responsibility and Declassified UK, 2020).
[26] Stuart Parkinson, Under the Radar: The Carbon Footprint of Europe’s Military Sectors, (West Yorkshire and Lancaster, UK: Conflict and Environment Observatory and Scientists for Global Responsibility, 2020), https://www.peacelink.it/disarmo/docs/5387.pdf.
[27] SOEs were responsible for over 23 percent of renewable capacity additions in 2014. See Andrew Prag, Dirk Röttgers, and Ivo Scherrer, “State-Owned Enterprises and the Low-Carbon Transition” OECD Environment Working Papers, no. 129 2018), https://doi.org/10.1787/06ff826b-en.
[28] Prag, Röttgers, and Scherrer, “State-Owned Enterprises.”
[29] How these are quantified and the choice of benchmarks for comparison is a matter of considerable debate.
[30] Several of the companies surveyed report “avoided emissions” based on the performance of low-emissions assets against a benchmark emissions intensity figure. Differences in the benchmarks used and methods for calculating avoided emissions mean they are not comparable in aggregate. Avoided emissions may also be termed “nega-emissions” and are similar in concept to the term “negawatt,” popularized in the energy efficiency discourse by Amory Lovins (Rocky Mountain Institute) as measuring a “hypothetical unit of power for . . . the amount of energy saved . . . because of efficient power consumption.” Techopedia, “Negawatt,” 2021, https://www.techopedia.com/definition/16548/negawatt.
[31] As described in Appendix I, estimates of emissions for nonreporting companies in the iron and steel, cement, and oil and gas sectors can be derived by combining production and emissions intensity data. Adding these derived emissions, the total rises to 8.87 GTCO2e per year.
[32] These include Ye Li et al., “Calculation of Life-Cycle Greenhouse Gas Emissions of Urban Rail Transit Systems: A Case Study of Shanghai Metro,” Resources, Conservation and Recycling 128 (2018), https://doi.org/10.1016/j.resconrec.2016.03.007Journal of Cleaner Production 58 (2013), https://doi.org/10.1016/j.jclepro.2013.07.006Journal of Cleaner Production 126 (2016), https://doi.org/10.1016/j.jclepro.2016.03.094https://www1.nyc.gov/assets/sustainability/downloads/pdf/GHG_Inventory_2… Zijia Wang, Feng Chen, and Taku Fujiyama, “Carbon Emission from Urban Passenger Transportation in Beijing,” Transportation Research Part D: Transport and Environment 41 (2015), https://doi.org/10.1016/j.trd.2015.10.001Nature Climate Change 6, no. 12 (2016), https://doi.org/10.1038/nclimate3169https://dataportal.orr.gov.uk/media/1843/rail-emissions-2019-20.pdf.
[33] Morgan Herve-Mignucci, Xueying Wang, David Nelson, and Uday Varadarajan, Slowing the Growth of Coal Power in China: The Role of Finance in State-Owned Enterprises (Climate Policy Initiative, 2015), https://www.climatepolicyinitiative.org/wp-content/uploads/2015/12/Slowing-the-Growth-of-Coal-Power-in-China-%E2%80%93-the-Role-of-Finance-in-State-Owned-Enterprises.pdf.
[34] Yan Qin, “Natural Gas in China’s Power Sector: Challenges and the Road Ahead,” Oxford Institute for Energy Studies, 2020, https://www.oxfordenergy.org/publications/natural-gas-in-chinas-power-sector-challenges-and-the-road-ahead/.
[35] Edimon Ginting and Kaukab Naqvi, Reforms, Opportunities, and Challenges for State-Owned Enterprises (Asian Development Bank, 2020).
Adkins, Liwayway, Philippe Benoit, Matt Gray, Christina Hood, George Kamiya, Caroline Lee, David Morgado, Cédric Philibert, and Jesse Scott. Energy, Climate Change and Environment: 2016 Insights. Paris: IEA. 2016.
Andrade, Carlos Eduardo Sanches de and Márcio de Almeida D’Agosto. “Energy Use and Carbon Dioxide Emissions Assessment in the Lifecycle of Passenger Rail Systems: The Case of the Rio De Janeiro Metro.” Journal of Cleaner Production 126 (2016): 526–36. https://doi.org/10.1016/j.jclepro.2016.03.094.
Arabesque S-Ray. “Arabesque S-Ray Company-Level Emissions Data.” (2021).
Belcher, Oliver, Patrick Bigger, Ben Neimark, and Cara Kennelly. “Hidden Carbon Costs of the ‘Everywhere War’: Logistics, Geopolitical Ecology, and the Carbon Boot‐Print of the US Military.” Transactions of the Institute of British Geographers 45, no. 1 (2020): 65–80. https://doi.org/10.1111/tran.12319.
Bellona Europa. “Steel and Emissions: How Can We Break the Link?.” March 25, 2019. https://bellona.org/news/ccs/2019-03-is-steel-stealing-our-future.
Benoit, Philippe. “Engaging State-Owned Enterprises in Climate Action.” Center on Global Energy Policy, Columbia University 2019. https://energypolicy.columbia.edu/research/report/engaging-state-owned-enterprises-climate-action.
———. “State-Owned Enterprises: No Climate Success without Them.” Journal of International Affairs 73, no. 1 (2019): 135–44. https://www.jstor.org/stable/10.2307/26872783.
ClimateWatch. “Historical GHG Emissions.” (2020). https://www.climatewatchdata.org/ghg-emissions.
Crawford, Neta C. “Pentagon Fuel Use, Climate Change, and the Costs of War.” Watson Institute, Brown University (2019).
Creutzig, Felix, Peter Agoston, Jan C. Minx, Josep G. Canadell, Robbie Andrew, Corinne Le Quéré, Glen Philip Peters, Ayyoob Sharifi, Yoshiki Yamagata, and Shobhakar Dhakal. “Urban Infrastructure Choices Structure Climate Solutions.” Nature Climate Change 6 (2016). https://doi.org/10.1038/nclimate3169.
Doll, Christopher N. H., and Osman Balaban. “A Methodology for Evaluating Environmental Co-Benefits in the Transport Sector: Application to the Delhi Metro.” Journal of Cleaner Production 58 (2013): 61–73. https://doi.org/10.1016/j.jclepro.2013.07.006.
Downs, Erica. “Green Giants? China’s National Oil Companies Prepare for the Energy Transition.” Center on Global Energy Policy, Columbia University (2021). https://www.energypolicy.columbia.edu/research/report/green-giants-china-s-national-oil-companies-prepare-energy-transition.
Forbes. “Forbes Global 2000, 2008–2020.” Edited by Arkadiusz Kanik. (2019). https://data.world/aroissues/forbes-global-2000-2008-2019.
“Getting the Numbers Right Project Emissions Report 2018.” Cement Sustainability Initiative, World Business Council for Sustainable Development (2018). https://gccassociation.org/gnr/Excel/GNR%20-%20Totals_&_Averages%20-%20Light%20Report%202018.xls.
Ginting, Edimon, and Kaukab Naqvi. Reforms, Opportunities, and Challenges for State-Owned Enterprises. Asian Development Bank. 2020.
Hasanbeigi, Ali, Marlene Arens, Jose Carlos Rojas Cardenas, Lynn Price, and Ryan Triolo. “Comparison of Carbon Dioxide Emissions Intensity of Steel Production in China, Germany, Mexico, and the United States.” Resources, Conservation and Recycling 113 (2016): 127–39. https://doi.org/10.1016/j.resconrec.2016.06.008.
Herve-Mignucci, Morgan, Xueying Wang, David Nelson, and Uday Varadarajan. Slowing the Growth of Coal Power in China: The Role of Finance in State-Owned Enterprises. Climate Policy Initiative. 2015. https://www.climatepolicyinitiative.org/wp-content/uploads/2015/12/Slowing-the-Growth-of-Coal-Power-in-China-%E2%80%93-the-Role-of-Finance-in-State-Owned-Enterprises.pdf.
International Civil Aviation Organization. “List of Government-Owned and Privatized Airlines.” (Last updated 2016). https://www.icao.int/sustainability/SiteAssets/Pages/Eap_ER_Databases/FINAL_Airlines%20Privatization.pdf.
International Energy Agency. CO2 Emissions from Fuel Combustion. IEA Statistics Division. 2019.
———. World Energy Outlook 2018. Paris: 2018.
Kowalski, Przemyslaw, Max Büge, Monika Sztajerowska, and Matias Egeland. State-Owned Enterprises: Trade Effects and Policy Implications. OECD Trade Policy Papers, no. 147. (2013). https://doi.org/10.1787/5k4869ckqk7l-en .
Lam, W. Raphael, and Alfred Schipke. “State-Owned Enterprise Reform.” In Modernizing China: Investing in Soft Infrastructure, edited by W. Raphael Lam, Markus Rodlauer, and Alfred Schipke, 307–32. Washington, DC: International Monetary Fund. 2017.
Li, Ye, Qing He, Xiao Luo, Yiran Zhang, and Liang Dong. “Calculation of Life-Cycle Greenhouse Gas Emissions of Urban Rail Transit Systems: A Case Study of Shanghai Metro.” Resources, Conservation and Recycling 128 (2018): 451–57. https://doi.org/10.1016/j.resconrec.2016.03.007.
MacWhinney, Ross. “Inventory of New York City Greenhouse Gas Emissions in 2017.” Mayor’s Office of Sustainability (2019). https://www1.nyc.gov/assets/sustainability/downloads/pdf/GHG_Inventory_2017.pdf.
Masnadi, Mohammad S., Hassan M. El-Houjeiri, Dominik Schunack, Yunpo Li, Jacob G. Englander, Alhassan Badahdah, Jean-Christophe Monfort et al. “Global Carbon Intensity of Crude Oil Production.” Science 361, no. 6405 (2018): 851–53. https://doi.org/10.1126/science.aar6859.
National Resource Governance Institute. National Oil Company Database. 2019.
OECD. The Size and Sectoral Distribution of SOEs in OECD and Partner Countries. Paris: OECD Publishing. 2017.
Office of Rail and Road. “Rail Emissions 2019–20.” (2020).
Parkinson, Stuart. The Environmental Impacts of the UK Military Sector. Halton, Lancaster, UK: Scientists for Global Responsibility and Declassified UK. 2020.
———. Under the Radar: The Carbon Footprint of Europe’s Military Sectors. West Yorkshire and Lancaster, UK: Conflict and Environment Observatory and Scientists for Global Responsibility. 2020. https://www.peacelink.it/disarmo/docs/5387.pdf.
Pek, Shibao, and Ben Caldecott. Physical Climate-Related Risks Facing Airports: An Assessment of the World’s Largest 100 Airports. Oxford: Sustainable Finance Programme, University of Oxford. 2020. https://www.smithschool.ox.ac.uk/research/sustainable-finance/publications/Physical-climate-risks-facing-airports-briefing-paper-September-2020.pdf.
Prag, Andrew, Dirk Röttgers, and Ivo Scherrer. “State-Owned Enterprises and the Low-Carbon Transition.” OECD Environment Working Papers, no. 129 (2018). https://doi.org/10.1787/06ff826b-en.
Qin, Yan. “Natural Gas in China’s Power Sector: Challenges and the Road Ahead.” Oxford Institute for Energy Studies (2020. https://www.oxfordenergy.org/publications/natural-gas-in-chinas-power-sector-challenges-and-the-road-ahead/.
RATP. “Committed to Climate Change.” (n.d.). https://www.ratp.fr/en/groupe-ratp/planet-and-city/committed-climate-change.
Techopedia. “Negawatt.” (2021). https://www.techopedia.com/definition/16548/negawatt.
United Nations Framework Convention on Climate Change. Adoption of the Paris Agreement. Paris. 2015.
Wang, Zijia, Feng Chen, and Taku Fujiyama. “Carbon Emission from Urban Passenger Transportation in Beijing.” Transportation Research Part D: Transport and Environment 41 (2015): 217–27. https://doi.org/10.1016/j.trd.2015.10.001.
Warwick Business School. “Finnair Found to Be Cleanest Airline in New Study.” April 26, 2016. https://www.wbs.ac.uk/news/finnair-found-to-be-cleanest-airline-in-new-study1/.
World Steel Association. Sustainability Indicators: 2020 Report. 2020.
In June 2022, the government of South Sudan acknowledged that Egypt had delivered equipment for resuming its long-dormant Jonglei Canal megaproject by dredging tributaries of the White Nile.
In 2021, India emitted 2.7 billion metric tons of CO2 or 7 percent of the global total, ranking third globally.
This workshop summary represents the research and views of the author. It does not necessarily...