In the waters off Malaysia, Iranian oil sales continue despite blockade
A large anchorage area off the coast of Malaysia is a major marketplace for sanctioned oil.
Get the latest as our experts share their insights on global energy policy.
The economic and humanitarian consequences of the June 24 twin earthquakes in Venezuela continue to emerge.
Hear in-depth conversations with the world’s top energy and climate leaders from government, business, academia, and civil society.
As the demand for power surges across the US, the debate over how to build energy infrastructure has reached a fever pitch. And while both sides of the...

Find out more about our upcoming and past events.
Join industry leaders, innovators, employers, and emerging talent for an evening exploring the technologies, trends, and career opportunities shaping the future of climate tech.

Commentary by Tom Moerenhout, Lilly Yejin Lee & James Glynn • June 12, 2023
This commentary represents the research and views of the author. It does not necessarily represent the views of the Center on Global Energy Policy. The piece may be subject to further revision. Contributions to SIPA for the benefit of CGEP are general use gifts, which gives the Center discretion in how it allocates these funds. More information is available at Our Partners. Rare cases of sponsored projects are clearly indicated.
Most key technologies for power sector and transportation decarbonization are mineral-intensive. An electric vehicle (EV), for example, requires twice as much copper and manganese as an internal combustion engine vehicle, and also needs lithium, nickel, cobalt, and graphite for its batteries (IEA 2021). Similarly, clean energy technologies such as wind turbines and solar PV, as well as the electricity grids needed to transmit their power, require more minerals per unit installed capacity than fossil fuel counterparts—up to 2 to 7 times (IEA 2021).
Theoretically, there is little fear of “peak supply” of critical minerals, given their abundance, unlike the peak oil supply arguments the energy world debated for the second half of the 20th century. But a restricted supply of critical minerals in the short term based on which reserves are economically recoverable and refinable can impact the price of components of energy technologies, making them less cost-competitive and slowing down new capacity deployment rates.
In this commentary, the authors discuss whether supply of critical minerals essential to the energy transition, particularly those with supply chains vulnerable to disruption or bottlenecks in the short to medium term,[1] will be able to meet demand, and what the consequences of potential supply-demand gaps could be on the feasible adoption of clean energy technologies. Renewable energy technologies and batteries require lithium, cobalt, nickel, copper, manganese, graphite, and rare earth elements. The authors assess whether any supply-side challenges could impact energy transition scenarios, including those that assume countries will achieve their specific or longer-term targets.[2]
Currently, critical mineral supply is an externality to the calculations of most global energy system models.[3] While influential in policy and investment decision-making, models do not take into account critical mineral supply constraints of physical volumes nor their costs (supply curves) in the overall system least-cost optimization or simulation. Most importantly, some models also do not consider the feasibility of critical mineral supply growth rate limits as a component of the expansion of new installed capacity for technologies that are crucial for the energy transition. In other words, some energy system models will allow new capacity of technologies to be installed when in the short term the capacity to produce the critical minerals to manufacture the new installed capacities may not exist at sufficient scale. While analysts can estimate actual critical mineral demand as a function of critical mineral intensity per new technology unit of capacity needed within the model scenarios, supply chain costs, production growth rates, and mine construction lead times are not included in many current energy system models.
Modeling innovation is needed to track and account for critical minerals from mine to end use, and thus fully endogenize supply chain capacity growth constraints into scenarios of transition from a fossil fuel energy system to a critical mineral energy system. This innovation is required to appropriately track investment risks and engineering risks, making decarbonization pathway analysis more robust—analysis that trillions of dollars of investment are based on.
Like for most other commodities, critical mineral supply responds to market signals. Unlike most other commodities, however, this response can take a long time—on average 16 years from discovery to first production (IEA 2021). That can result in a temporary supply deficit and, consequently, a price increase, price volatility, and new capacity deployment rate volatility. The International Monetary Fund (IMF) estimates that the supply of all metals, except for lithium, are quite inelastic over the short term (one to three years) but more elastic over the long term (20 years) (Boer et al. 2021). The IMF also finds that lithium, cobalt, nickel, and copper prices could reach historic peaks for a prolonged period under net-zero scenarios. Supply and price constraints could thus considerably slow the pace of low-carbon new capacity technology deployment, and, without immediate corrective policy and investment, may put the 1.5°C Paris agreement goal out of reach.
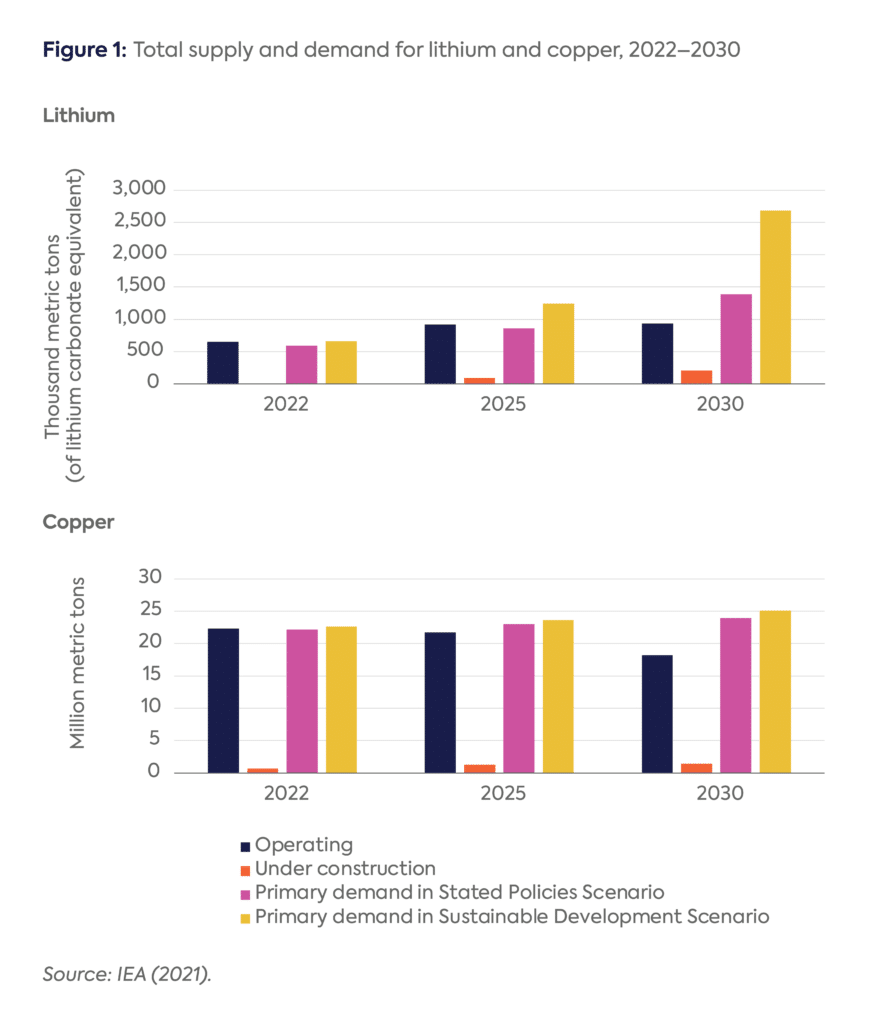
Based on today’s production and new production plans, it is expected that demand for certain critical minerals (specifically copper and lithium) will start outpacing supply in this decade. For example, the International Energy Agency (IEA) expects in its Stated Policies Scenario (STEPS) that demand for copper can outpace supply by the second half of this decade from mines that are currently operating or under construction (IEA 2021), which is in line with S&P estimates that foresee supply shortfalls as of 2025, lasting for most of the following decade (S&P Global 2022). The IEA estimated that for lithium and cobalt supply shortfalls will commence by 2028, even if there is now more uncertainty given the lower use of cobalt in batteries. If mining capacity under construction does not deliver as expected, copper could face shortages starting this year, and lithium by 2027 (IEA 2021).
Even without immediate supply gaps, critical mineral prices have increased in the past two years. This is in part due to supply chain issues and in part due to a higher need for those minerals in the energy transition and economic recovery more generally (i.e., anticipated higher demand).
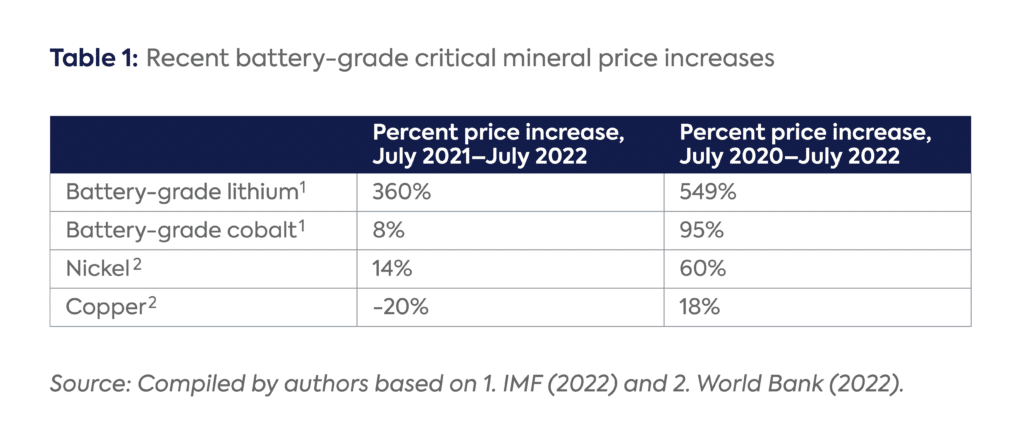
The IEA estimated that price increases from the beginning to the end of 2021 were about 700 percent for lithium, 150 percent for cobalt, 90 percent for nickel, and 34 percent for copper (IEA 2021). These price increases were larger than any other annual price increase for those commodities in the last decade. Updated data show that increases are somewhat moderated when considering longer time frames. A price reduction even occurred for copper between July 2021 and July 2022 (see Table 1), which is mainly explained by the zero-Covid policy in China and associated fears of an economic slowdown. Recent lower copper prices could add to supply deficits in the coming years, as they may discourage investment in copper mining today (Attwood 2022). The price of lithium decreased in the first months of 2023, but that was mainly due to cathode manufacturers using up inventories and a temporary slowdown in EV demand in China; outside of China, lithium prices decreased far less, indicating the continuation of a very tight market that is vulnerable to price volatility (Benchmark Mineral Intelligence 2023a, 2023b).
Table 1 shows the general upward trajectory of prices for critical minerals in the 2021–2022 price surge. The two-year period shows a very strong increase. Indeed, prices for critical minerals can be volatile, including moving lower in certain periods, but strong medium-term demand growth suggests the era of low critical mineral prices may be over, at least for the next decade.
Recent price increases for critical minerals are already slowing down the pace of price reduction for clean energy technologies. The key cost component of an EV is the battery pack, and the key cost component of the battery pack are cathodes, which consist of critical minerals such as lithium, cobalt, nickel, and manganese. During the last decade, the cost of EVs has decreased substantially alongside battery pack costs, which decreased by 65 percent between 2015 and 2021 (IEA 2022b). One key factor in this price decline besides technology development was the relatively low prices of cobalt, lithium, nickel, and copper in the 2010s. In recent years, however, battery pack prices have slowly started stagnating, and increased 10 percent globally in 2022, in part because of the price increase of minerals used in the cathodes, which now account on average for about 22 percent of the cost of a battery pack (IEA 2021; IEA 2023).
Wind energy infrastructure requires a lot of copper and zinc, as well as manganese and chromium, whereas solar requires copper and silicon. Until 2021, technology costs appeared to continue decreasing because of the time lag before rising commodity and equipment prices pass through into project costs. But as costs remain high, overall renewable energy costs may have risen in 2022 (IRENA 2022). The IEA does note that total solar and wind investment cost estimates for new contracted projects went up in 2022 by about 15 to 25 percent compared to 2020 (IEA 2022c), some of this increase potentially related to higher prices for critical minerals. Other materials, such as steel, and copper substitutes, such as aluminum, have also seen price increases. While supply challenges affect price, they have not necessarily affected competitiveness with other energy sources yet, given that fossil fuel prices have been skyrocketing (IEA 2022c).
Currently available price projections sketch a complicated future. For copper, estimates predict a price increase from about $7,500 per million metric tons (Mt) to between $9,750/Mt (Moors and Keen 2022) and $15,000/Mt (Attwood 2022) by the middle of the decade. Goldman Sachs predicts that prices for lithium in the coming three to four years will actually decrease, since production covers anticipated demand (Rivero 2022), but in an unusual move, Benchmark Minerals Intelligence released a response to Goldman’s analysis to point out some errors of judgment (Benchmark Minerals Intelligence 2022).
Benchmark is now expecting a 12.5 percent supply deficit by 2030 (Benchmark Minerals Intelligence 2023c). Even if prices decline for a short period of time, EV prices may follow suit, potentially raising demand and contributing to upward pressure on lithium prices by the end of the decade. The IEA’s moderately ambitious climate scenario (the Sustainable Development Scenario, which would keep global warming below 2°C) estimates supply-demand gaps for lithium and copper during this decade (see Figure 1). (For the more ambitious Net Zero Emissions by 2050 Scenario, demand also considerably outstrips supply for nickel and cobalt in 2030 [IEA 2022b].)
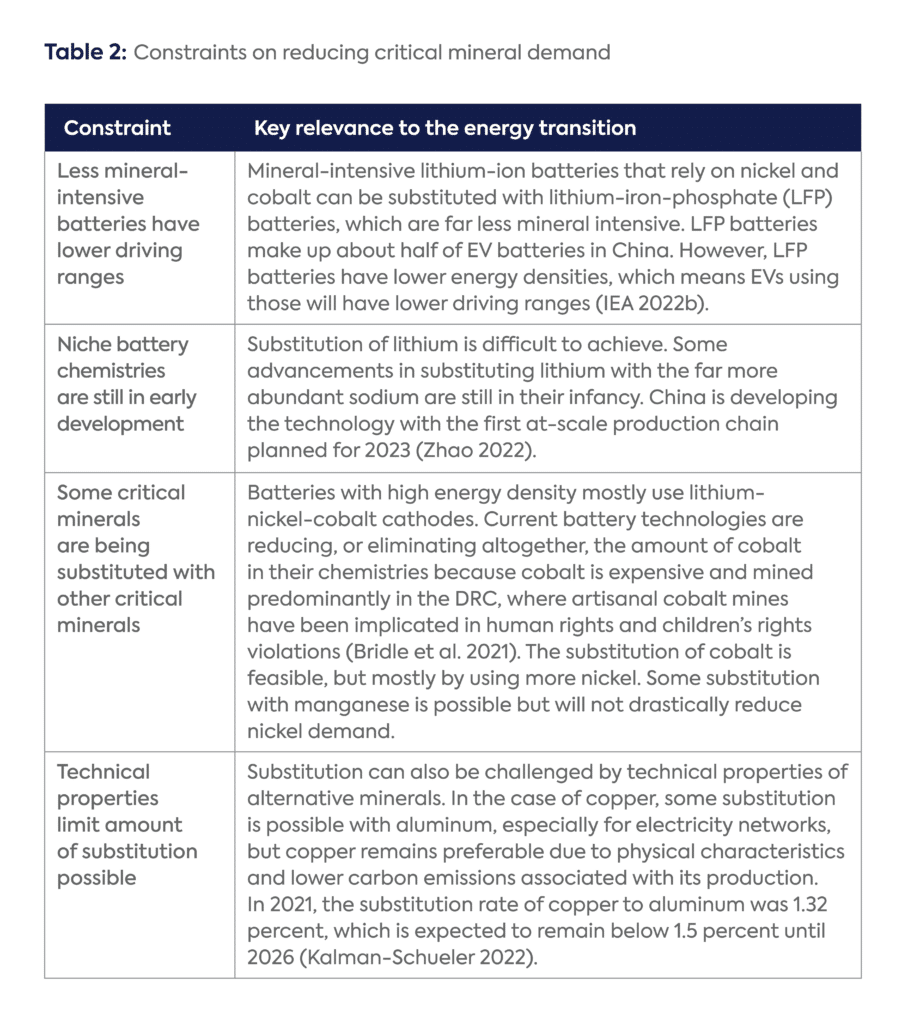
Critical mineral supply-side constraints are already evoking reactions. On the demand side, mineral substitution and increasing mineral efficiency within existing technologies are underway. But constraints to greater demand reduction arise from the specific properties needed in energy transition applications and the pace at which innovation can happen (see Table 2).
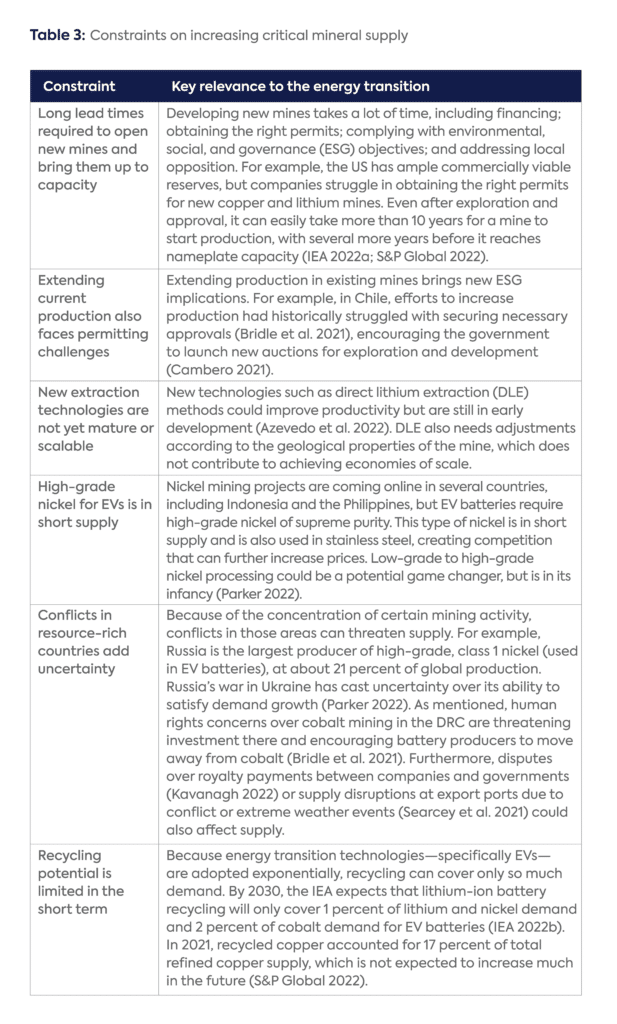
On the supply side (see Table 3), increasing the amount of critical minerals through new mines or increasing production and production efficiency at existing mines are on the agenda of many companies and governments. While it is difficult to predict disruptive technological advancements in clean energy technologies, it is important to remain prudent and realistic about the time frames in which they might reach commercial scale.
The biggest constraints to addressing the supply-demand gap are mostly related to the sheer size and pace of additional demand that will come to the market. To stay on track for net zero, energy-related demand for copper, lithium, cobalt, nickel, and neodymium is expected to grow between 3- and 14-fold (depending on the mineral) by 2030 compared to 2021 (IEA 2023). Another study finds that copper demand will double by 2035 and that supply shortfalls could happen as early as 2024 (S&P Global 2022). To meet this anticipated copper demand, three new mines would have to be opened every year for the next 29 years, costing over $500 billion in total (S&P Global 2022). For batteries, expected demand increases would require 30 new lithium mines to cover a little over 300 thousand metric tons (kt) per year, 41 new nickel mines to cover a little over 4,000 kt/year, and 11 new cobalt mines to cover 250 kt/year by 2030. If announced pledges are to be met, this would be 50 new lithium mines (to cover almost 500 kt/year), 60 new nickel mines (to cover almost 5,000 kt/year), and 17 new cobalt mines (to cover almost 300 kt/year) by 2030. These additional mines would still fall short of supplying the amount of minerals needed to achieve net zero by 2050 (IEA 2022b). This is in the ballpark of Benchmark Mineral Intelligence, which estimates about 336 new mines are needed by 2035 if battery materials are recycled in large enough quantities (CBC News 2022).
Energy system optimisation models (ESOMs), simulation models, and integrated assessment models (IAMs) are hugely complex data-intensive modeling initiatives developed by a relatively small community globally. And while the last decade of ESM research and innovation has prioritized integrated energy-climate mitigation assessment, as evidenced by the new IEA Global Energy and Climate (GEC) Model framework, there are only a handful of ESOM modelers within the community exploring security, resilience, and supply of critical minerals in decarbonization pathways.
There are two key issues of concern in long-term energy scenario (LTES) tools used by international energy modeling agencies (including the IEA and the International Renewable Energy Agency [IRENA]) and many of the models within the Integrated Assessment Modelling Consortium used by the Intergovernmental Panel on Climate Change:
This means that in current energy system models, the insufficient supply chain for critical minerals that represents a real-world hard constraint on new capacity technology deployment rates is left out. Some ESOMs allow for new capacity of technologies to be installed at the scale required for climate stabilization that in the near-term real world could not actually be produced based on the critical minerals required to manufacture them. Therefore, the near-term inelastic hard constraint on EVs, solar PV, and wind turbine deployment rates in the energy transition is not reflected in these models.
Endogenizing critical mineral supply rates into models can readily be implemented similarly to how fossil fuel resources and reserves are represented with a production cost for each type of barrel for each geography, developing a curve from the cheapest to the last marginal barrel. Currently, there is no coordinated dataset in the energy system modeling community for cheapest to most expensive metric ton of various critical minerals by mine or geography.
The feasibility of future investment decisions is not constrained in current generation ESOMs by an inadequate supply of critical minerals to support optimal new installed capacity of lithium-ion batteries, solar PV panels, and to a lesser degree wind turbines. Modeling innovation is required to track and account for critical minerals from mine to end use to appropriately assess risks and vulnerabilities in decarbonization pathways and the security of these pathways on which trillions of dollars of investment are based.
Leading ESOMs, such as the IEA’s World Energy Model (WEM) and Energy Technology Perspectives (ETP) model, now coupled in the hybrid framework GEC Model, estimate mineral demand by looking at four main variables (IEA, 2022c):
The pace of mineral intensity improvements varies by scenario. STEPS generally sees smaller improvement over time, whereas SDS sees faster improvement (around 10 percent in the longer term) due to assumed technology learning with deployment. The IEA uses different improvement rates (ex-post) for technologies that would benefit from economies of scale or other factors (e.g., silicon and silver use in solar PV, and rare earth element use in wind turbines), typically based on assumptions from expert consultation within the IEA’s technology collaboration programs. The remaining drivers of demand depend on historicalconsumption of end-use applications, relevant activity drivers (e.g., GDP, industry value added, vehicle activities, steel production), and material intensities. This approach possibly allows decarbonization rates in the near term that are faster than physically possible due to the omission of this supply constraint.
This methodological gap is only now coming to light, and while IEA modelers recently announced plans to pivot research efforts toward resolving this knowledge and modeling gap,[4] improved decarbonization pathways with updated mineral supply constraints are likely still years away from completion.
On the supplyside, the IEA uses public data sources along with BNEF and S&P Global Data, which may be best in class but might not be comprehensive enough for accurate representation of global production capacity (based on the factors outlined in this commentary). Of particular concern is the understanding of secondary production of critical minerals in existing energy technology stocks: little is known about recycling rates, so modelers use the average recycling rate and life time of each end-use sector, such as by vehicle type (transport sector) or wind turbine vintage (electricity sector). However, the critical minerals industry is so nascent that many modeling assumptions made based on other sectors are not valid (e.g., lead-acid batteries are relatively easily recyclable but fundamentally different from lithium-ion batteries).
Finally, ESOMs typically assume declining prices of commodities and technologies as a result of energy technology learning (ETL) and economies of scale of production and deployment. However, as discussed, greater deployment of wind and solar technologies within a constrained supply chain scenario can result in commodity and technology prices stagnating and even increasing. Cumulative supply S-curves representing feasible reserve capacity growth bounds, similar to how fossil fuels supplies are represented in many global ESOMs, could be applied to critical mineral supply constraints in ESOMs. Beyond this, and depending on the capabilities of the model framework being used, individual processes within the critical mineral supply chain, such as mining, refining, production, and transport, could be characterized. This would better enable specific construction costs, lead times, and feasible growth rates to be incorporated in deep decarbonization analysis.
Several simultaneously occurring supply-side and demand-side constraints can restrict the production and refining growth of the critical minerals needed for clean energy technologies to maintain global warming within the 1.5°C and even 2°C limit and can lead to price increases and price volatility for these minerals. Long-term energy scenarios are not forecasts; they are our best possible maps of future pathways for the evolution of the energy system that are required to meet stated goals of stabilizing the climate while meeting energy service demands in a secure and sustainable manner. To better plan ahead and achieve decarbonization goals, it is essential that real-world constraints be included in energy system models.
Constraints to demand reduction include the mineral intensity needed for batteries with greater energy density and the current technical limits to substituting in alternative, abundant minerals. Constraints to supply include long lead times to opening new mines and permitting challenges for extending production at existing ones, the infancy of new extraction technologies, competition for critical minerals with other sectors, conflicts in resource-rich countries, and limited recycling potential.
Because previously estimated feasible rates of deployment of clean energy technologies in techno-economic ESOMs did not incorporate the impacts of looming upstream and midstream bottlenecks, the scale and pace at which investment needs to flow into critical mineral supply to meet net-zero emissions goals is likely considerably underestimated. Energy system modelers and decision makers need to rapidly endogenize critical mineral supply chain investment needs—for producing minerals and refining them into useful technology components—into models and their near-term decision-making processes in order to close the ambition-reality gap.
While investment is deficient to bridge the ambition-reality gap for successful climate mitigation, the technical and timing components of this gap are also being underestimated due to the omission of critical mineral supply constraints in techno-economic ESOMs. This results in false assumptions that climate mitigation policy pledges are technically feasible at a pace needed for NZE in the current engineering and investment paths of our energy system. Tools used for charting a course to net-zero scenarios need to better account for volatility, myopia, and uncertainty in critical mineral supply, as it becomes clear that the pathways to a net-zero energy system will be bumpy rather than smooth, as the best models currently estimate.
Attwood, James. 2022. “A Great Copper Squeeze Is Coming for the Global Economy.” Bloomberg.com, September 21, 2022. https://www.bloomberg.com/news/articles/2022-09-21/copper-prices-fall-despite-signs-of-looming-crucial-metal-shortage.
Benchmark Minerals Intelligence. 2022. “Lithium Oversupply? Not Likely—Five Main Reasons Why.” Benchmark Source, June 9, 2022. https://source.benchmarkminerals.com/article/lithium-oversupply-not-likely-five-main-reasons-why.
———. 2023a. “Ex-China Lithium Premium Highlights a Market Still Short of Supply.” Benchmark Source, March 15, 2023. https://source.benchmarkminerals.com/article/ex-china-lithium-premium-highlights-a-market-still-short-of-supply.
———. 2023b. “Chinese Lithium Prices Almost Halve from November Peak as Demand Weakens.” Benchmark Source, March 23, 2023. https://source.benchmarkminerals.com/article/chinese-lithium-prices-almost-halve-from-november-peak-as-demand-weakens.
———. 2023c. “Albemarle’s Turbo-Charged Demand Data Showcases Lithium’s Growing Supply Problem.” Benchmark Source, January 26, 2023. https://source.benchmarkminerals.com/article/opinion-albemarles-turbo-charged-demand-data-showcases-lithiums-growing-supply-problem.
Boer, Lukas, Andrea Pescatori, and Martin Stuermer. 2021. “Energy Transition Metals.” International Monetary Fund, October 2021. https://www.imf.org/-/media/Files/Publications/WP/2021/English/wpiea2021243-print-pdf.ashx.
Bridle, Richard, Christophe Bellman, Vicente Loyola, Mostafa Mostafa, and Tom Moerenhout. 2021. “Driving Demand: Assessing the Impacts and Opportunities of the Electric Vehicle Revolution on Cobalt and Lithium Raw Material Production and Trade.” International Institute for Sustainable Development, July 2021. https://www.iisd.org/system/files/2021-07/electric-vehicle-cobalt-lithium-production-trade.pdf.
Burton, James. 2022. “U.S. Geological Survey Releases 2022 List of Critical Minerals.” US Geological Survey, February 22, 2022. https://www.usgs.gov/news/national-news-release/us-geological-survey-releases-2022-list-critical-minerals.
Cambero, Fabian. 2021. “Chile Launches Lithium Auction to Rev up Stalled Production.” Reuters, October 14, 2021. https://www.reuters.com/article/chile-lithium-idUSKBN2H42FK.
CBC News. 2022. “More than 300 New Mines Needed to Meet Electric Vehicle Demand, Says Analyst.” CBC News, September 25, 2022. https://www.cbc.ca/news/canada/sudbury/new-mines-electric-vehicles-1.6594008.
Dela Cruz, Enrico. 2022. “Philippines Expecting a Dozen New Mines This Year, Mostly Nickel.” Reuters, March 11, 2022. https://www.reuters.com/article/philippines-nickel/update-1-philippines-expecting-a-dozen-new-mines-this-year-mostly-nickel-idUSL2N2VE09L.
GAO. 2022. “Critical Minerals.” United States Government Accountability Office, June 2022. https://www.gao.gov/assets/gao-22-104824.pdf.
Graefe, Laurel. 2009. “Peak Oil Debate: A Reprint from the ‘Economic Review.’” Federal Bank of Atlanta Economic Review 94 (2009). https://www.econstor.eu/bitstream/10419/57664/1/683500546.pdf.
IEA. 2021. “The Role of Critical Minerals in Clean Energy Transitions.” International Energy Agency, 2021. https://iea.blob.core.windows.net/assets/ffd2a83b-8c30-4e9d-980a-52b6d9a86fdc/TheRoleofCriticalMineralsinCleanEnergyTransitions.pdf.
———. 2022a. “Global Energy and Climate Model,” International Energy Agency, October 2022. https://www.iea.org/reports/global-energy-and-climate-model.
———. 2022b. “Global Supply Chains of EV Batteries.” International Energy Agency, 2022. https://iea.blob.core.windows.net/assets/4eb8c252-76b1-4710-8f5e-867e751c8dda/GlobalSupplyChainsofEVBatteries.pdf.
———. 2022c. “Renewable Energy Market Update 2022.” International Energy Agency, 2022. https://iea.blob.core.windows.net/assets/d6a7300d-7919-4136-b73a-3541c33f8bd7/RenewableEnergyMarketUpdate2022.pdf.
———. 2023. “Energy Technology Perspectives 2023.” International Energy Agency, January 2023. https://www.iea.org/reports/energy-technology-perspectives-2023.
IMF. 2022. “Primary Commodity Prices.” IMF, 2022. https://www.imf.org/en/Research/commodity-prices.
IRENA. 2022. “Renewable Power Generation Costs in 2021.” International Renewable Energy Agency, July 2022. https://irena.org/publications/2022/Jul/Renewable-Power-Generation-Costs-in-2021.
Kalman-Schueler, Krisztina. “Copper Substitution Survey 2022.” 2022. https://copperalliance.org/wp-content/uploads/2022/03/Substitution.pdf.
Kavanagh, Michael. “Giant Congo Cobalt Mine Exports at Risk as Investors Feud.” Bloomberg.Com, July 8, 2022. https://www.bloomberg.com/news/articles/2022-07-08/giant-cobalt-mine-s-export-from-congo-at-risk-as-investors-feud.
Moors, Camellia, and Kip Keen. 2022. “Looming Copper Shortage Shifts Attention to Alternative Supply Solutions.” S&P Global, September 7, 2022. https://www.spglobal.com/marketintelligence/en/news-insights/latest-news-headlines/looming-copper-shortage-shifts-attention-to-alternative-supply-solutions-71920158.
Parker, Darren. 2022. “Russia-Ukraine Conflict Creates Uncertainty for High-Grade Nickel Supply.” Mining Weekly, July 11, 2022. https://www.miningweekly.com/article/russia-ukraine-conflict-creates-uncertainty-for-high-grade-nickel-supply-2022-07-11.
Rivero, Nicolas. 2022 “A Glut of Cheap Lithium Could Bring Down EV Prices Next Year.” Quartz, June 1, 2022. https://qz.com/2172104/a-glut-of-cheap-lithium-could-bring-down-ev-prices-next-year/.
Searcey, Dionne, Michael Forsythe, Eric Lipton, and Ashley Gilbertson. 2021. “A Power Struggle Over Cobalt Rattles the Clean Energy Revolution.” New York Times, November 20, 2021. https://www.nytimes.com/2021/11/20/world/china-congo-cobalt.html.
S&P Global. 2022. “The Future of Copper.” S&P Global, July 18, 2022. https://ihsmarkit.com/research-analysis/growing-appetite-copper-threatens-energy-transition-climate.html.
USGS. 2022. “2022 Final List of Critical Minerals.” Federal Register 87, no. 37 (February 24, 2022): 2.
World Bank. 2022. “Commodity Markets.” World Bank, 2022. https://www.worldbank.org/en/research/commodity-markets.
[1] The US government definition of critical minerals is more restrictive than how the term is used in this commentary, in that the government also specifically looks at current import reliance and as such excludes critical minerals such as copper from their list (USGS 2022; Burton 2022).
[2] For instance, the Net Zero Emissions by 2050 Scenario (NZE) at the International Energy Agency (IEA) assumes that the world achieves net zero emissions by 2050 with individual countries achieving net zero emissions by or before 2050. The Announced Pledges Scenario (APS) assumes that the targets set forward by countries are met by the announced date.
[3] For example, the IEA’s Global Energy and Climate Model (https://www.iea.org/reports/global-energy-and-climate-model/about-the-global-energy-and-climate-model) and the Integrated Assessment Modelling Consortium (IAMC) model documentation wiki (https://www.iamcdocumentation.eu/index.php/IAMC_wiki).
[4] See the “IEA Critical Minerals and Clean Energy Summit” background information, at https://www.iea.org/events/iea-critical-minerals-and-clean-energy-summit.
In early 2026, CGEP held a roundtable and several hybrid closed-door meetings in Mexico City on Mexico's mining sector.
Raw material vulnerability was once again at the center of the G7 agenda at the summit in Evian, France.

Critical minerals were once again near the top of the agenda for G7 leaders as they met in Évian, France, this week, a year after the G7 launched the Critical Minerals Action Plan.

Full report
Commentary by Tom Moerenhout, Lilly Yejin Lee & James Glynn • June 12, 2023