This website uses cookies as well as similar tools and technologies to understand visitors’ experiences. By continuing to use this website, you consent to Columbia University’s usage of cookies and similar technologies, in accordance with the Columbia University Website Cookie Notice.
The Center on Global Energy Policy (CGEP) at Columbia University SIPA today released a new report examining Project-based Carbon Credit Markets (PCCMs) in G20 countries and Singapore. A...
Announcement• June 17, 2026
Energy Explained
Get the latest as our experts share their insights on global energy policy.
The 109-day-old Iran crisis is heading toward an off-ramp in the form of a not-yet-public Memorandum of Understanding to reopen the Strait of Hormuz. While energy markets are...
This event will take place in-person in Washington DC, at the Rayburn House Office Building, Room 2168 (Gold Room). Advance registration is required. Announcing New Columbia University Publications...
We are the premier hub and policy institution for global energy thought leadership. Energy impacts every element of our lives, and our trusted fact-based research informs the decisions that affect all of us.
This Energy Explained post represents the research and views of the author. It does not necessarily represent the views of the Center on Global Energy Policy. The piece may be subject to further revision. Contributions to SIPA for the benefit of CGEP are general use gifts, which gives the Center discretion in how it allocates these funds. Rare cases of sponsored projects are clearly indicated.
For a full list of financial supporters of the Center on Global Energy Policy at Columbia University SIPA, please visit our website at Our Partners. See below a list of members that are currently in CGEP’s Visionary Circle. This list is updated periodically.
The Environmental Protection Agency (EPA) recently released United States power sector data, the Emissions and Generation Resource Integrated Database (eGRID), which includes demographic data within three miles of each US power plant for 2021. eGRID is recognized as valuable to those in federal, state, and local governments, nongovernmental organizations, academia, and companies seeking environmental information from the electric power sector in the US. This analysis focuses specifically on current data from the demographic groups of low-income and minority communities to determine the spatial correlation between locations of power plants emitting local air pollution and these communities.
Unlike greenhouse gases, air pollution—which is often heavier than air—sinks through the local atmosphere once emitted from a power plant, affecting pollutant concentrations and causing health impacts.[1] While air quality in the US has dramatically improved, it is notable that at a national level, air pollution is accountable for between 60,000 to 200,000 deaths annually,[2] with half of these deaths attributable to fossil fuel combustion.[3] There is ample historical research that indicates these effects are often greatest in low-income and minority communities,[4] but it is critical to explore the current dataset now with Inflation Reduction Act (IRA) incentives set to stimulate large-scale infrastructure growth for energy transition. As Bob Bullard, a scholar of urban planning and environmental policy and member of the White House environmental justice advisory council, noted recently, the US may have “a history and legacy of experimenting on black and brown communities.”[5] But in the IRA, the country now has the opportunity to manage investments with equity considerations.
Mapping the Spatial Inequity
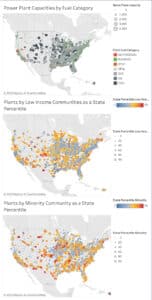
Nitrogen oxides (NOx) and sulfur dioxides (SO2) are the local air pollution emissions considered in this analysis. Of the three maps in Figure 1, the first gives an overview of power plant locations in the lower 48 US states, where the size of the circles represents the capacity (size) of the power plants, colored by fuel category, to include local air pollution emitters only.
The second map illustrates power plant locations mapped to different income groups as state percentiles, with large red dots representing low-income populations. The eGRID dataset classifies low-income as the percent of the population in households whose income is less than or equal to twice the federal poverty level (FPL).[6] The red color depicts the 99th percentile of people who live within three miles of a power plant emitting NOx and SO2, and have a maximum income of double the FPL. According to the Department of Health and Human Services (HHS) in January 2023, twice the FPL corresponds to an income of $29,160 for a household of one, which increases to $60,000 for a household of four across the 48 contiguous states.[7]
The third map illustrates power plant locations colored by minority groups as state percentiles, with large red dots representing power plants with predominantly minority communities nearby. The eGRID dataset classifies minority as the percent of individuals who list their racial status as a race other than white alone and/or list their ethnicity as Hispanic or Latino.[8] The red color in this case depicts communities where the 99th percentile of people, who live within three miles of a power plant emitting NOx and SO2, self-identify as a race other than white alone and/or list their ethnicity as Hispanic or Latino.
Figure 1: Mapping of power plant locations and low-income and minority populations
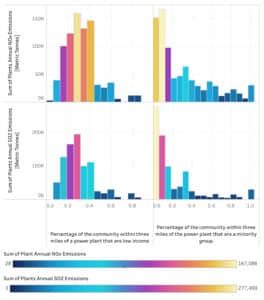
The spatial correlation between local air pollution emitters of NOx and SO2 and low-income and minority communities, based on the current dataset and aggregating for all fuels, is illustrated in Figure 2. Of the population living within three miles of a power plant, communities where 25 percent are low-income households and 10 percent are minorities experience the highest annual emissions impact of NOx and SO2.
Figure 2: Annual plant emissions distribution by demographic
Why This Analysis Matters as the US Decarbonizes
Decarbonization will require a rapid transformation of the nation’s electricity generation mix as the energy transition gathers pace.[9] The US has committed to decarbonizing the power sector by 2035 with 100 percent clean electricity. Additionally, there is the challenge of integrating variable renewable generation capacity cost effectively into other hard-to-abate sectors to achieve net zero by 2050. Large-scale electrification will be necessary in line with calls to “electrify everything that makes sense.”[10] The adoption of electric end-use technologies in place of fossil-fueled substitutes, known as electrification, is a vital economy-wide decarbonization strategy that also minimizes pollutant emissions and improves air quality.[11] But concerns around disproportionate impact of local air pollution on low-income and minority communities remain valid, even as the energy transition gathers pace, for two reasons: first, because fossil fuel generation will likely comprise an element of this transition for some years to come, and second, to ensure that spatial inequities do not persist alongside the rapid transformation of the nation’s electricity generation mix.[12]
Recently, the Center on Global Energy Policy (CGEP) at Columbia University SIPA published a report, “Electrification on the Path to Net Zero,” that discussed a comparison of studies examining opportunities for and barriers to electrification in the US.[13] It found that to meet the demands of an electrified economy, electricity generation will need to grow up to four times the current levels. Starting in 2020, current electricity generation levels of 3,900–4,300 terawatt-hours (TWh) will need to grow to between 5,000–16,000 TWh by 2050, depending on the degree of electrification and the actual demand for electric vehicles, heat pumps, and other electrification end uses. Similarly, the US Energy Information Administration’s 2023 Annual Energy Outlook projects energy consumption increases through 2050 as population and economic growth outweigh efficiency gains.[14]
While it is clear electrification is fundamental to achieving net zero, it also begs the question of where all the additional power supply will be sited. Achieving a more orderly transition nationally may entail balancing the accelerated decommissioning of fossil-fueled generation assets with incremental investments in lower-emissions power production.[15]
Another important part of the IRA is ensuring investment is targeted to fix transmission grid congestion, renewables curtailment, and backlogs, as electricity transmission is the key to unlocking the full potential of the climate legislation. Researchers at the Princeton-led REPEAT project recently estimated that new federal subsidies for clean energy could cut electricity emissions in half by 2030.[16] But that assumes transmission capacity expands twice as fast over the next decade in order to interconnect new renewable resources at sufficient pace. If that doesn’t happen, emissions could actually increase as solar and wind get stymied and existing fossil plants run more often to meet the growing demand from large-scale electrification.
Conclusion
The current dataset indicates that power plants emitting local air pollution disproportionately affect low-income and, to a somewhat lesser extent, minority communities. Minority groups are affected differently by power plants with differing fuel categories, an area that authors will explore and discuss in future analyses. The IRA presents an opportunity to address the current disproportionate impacts of electricity infrastructure on these communities. It can advance President Biden’s Justice40 Initiative, “which commits to delivering 40 percent of the overall benefits of climate, green energy, infrastructure, and other investments to disadvantaged communities and including those that have been disproportionately negatively affected by fossil fuels,” as stated by US energy secretary Jennifer M. Granholm.[17] With benefits directed toward disadvantaged communities, future releases of EPA’s eGRID data will likely show a trend of diminishing negative health impacts from power sector emissions.
_______
Methodology
The eGRID dataset was downloaded from the Environmental Protection Agency’s website into the visual analytics platform Tableau Desktop 2023.1, and a hyper extract was created to generate maps and histograms. Geospatial point locations representing every power plant included in the eGRID dataset were created from longitude and latitude metadata. This data was then linked with each census tract demographic data for low-income and minority communities. A second data union joined power plant data and local demographic data within three miles of each power plant using unique power plant identifiers in the eGrid dataset. Maps were created in Tableau for individual power plants within the dataset and filtered for those fuels that emit NOx and SO2. Subsequently histogram distributions were developed for the correlation between summed annual emissions by metric tonne and aggregated communities grouped into separate bins for low-income and minority groups. Census tract shape files were imported into Tableau to explore the spatial correlation of power plant location data with demographic data, but ultimately the census tract shape files did not provide additional insights in this specific analysis.
Foundations and Individual Donors Anonymous Anonymous the bedari collective Jay Bernstein Breakthrough Energy LLC Children’s Investment Fund Foundation (CIFF) Arjun Murti Ray Rothrock Kimberly and Scott Sheffield
Notes
[1] C. W. Tessum, D. A. Paolella, S. E. Chambliss, J. S. Apte, J. D. Hill, and J. D. Marshall, “PM2.5 polluters disproportionately and systemically affect people of color in the United States,” Sci Adv, vol. 7, no. 18, pp. 4491–4519, Apr. 2021, https://doi.org/10.1126/sciadv.abf4491.
[2] The wide range represents the uncertainty and multiple sources of the emissions including, power plants; power plants and transport combustion; power plants, transport combustion, transport tires and brakes particles.
[4] M. P. S. Thind, C. W. Tessum, I. L. Azevdeo, and J. D. Marshall, “Fine Particulate Air Pollution from Electricity Generation in the U.S.: Health Impacts by Race, Income, and Geography,” Environ Sci Technol, vol. 53, no. 23, pp. 14010–14019, Dec. 2019, https://pubs.acs.org/doi/10.1021/acs.est.9b02527.
[9] T. Goforth and D. Nock, “Air pollution disparities and equality assessments of U.S. national decarbonization strategies,” Nat Commun, vol. 13, no. 1, Dec. 2022, https://www.nature.com/articles/s41467-022-35098-4.
[12] T. Goforth and D. Nock, “Air pollution disparities and equality assessments of U.S. national decarbonization strategies,” Nat Commun, vol. 13, no. 1, Dec. 2022, https://www.nature.com/articles/s41467-022-35098-4.
[16] J. D. Jenkins, J. Farbes, R. Jones, N. Patankar, and G. Schivley, “Electricity Transmission is Key to Unlock the Full Potential of the Inflation Reduction Act repeatproject.org,” NJ, 2022, https://zenodo.org/record/7106176#.ZFu-gOzMIe0.
The US Secretary of Energy Chris Wright has directed the Federal Energy Regulatory Commission to make a rule that would help rapidly move electricity onto the US grid in large amounts.
President Donald Trump's first official foreign policy trip, as in his first term, was to Saudi Arabia earlier this month, with additional stops in Qatar and the United Arab Emirates.
While tens of millions of people work in formal energy jobs around the world, another group that comprises a massive and key labor segment in this sector is often overlooked: women and girls producing biomass