This website uses cookies as well as similar tools and technologies to understand visitors’ experiences. By continuing to use this website, you consent to Columbia University’s usage of cookies and similar technologies, in accordance with the Columbia University Website Cookie Notice.
The Trump administration and Saudi leadership have reportedly agreed to a nuclear agreement that could enable US nuclear technology transfers to Saudi Arabia.
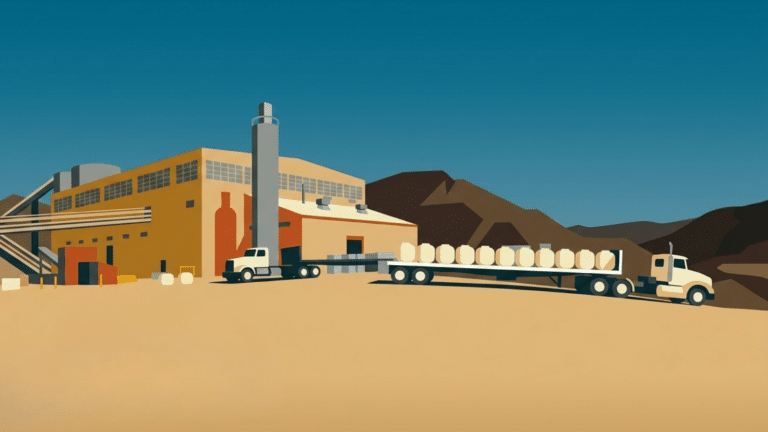
Critical minerals sit at the intersection of energy technology, industrial competitiveness, and economic resilience. The issue has hit a fever pitch in the United States, driving the Trump...
We are the premier hub and policy institution for global energy thought leadership. Energy impacts every element of our lives, and our trusted fact-based research informs the decisions that affect all of us.
This Energy Explained post represents the research and views of the author. It does not necessarily represent the views of the Center on Global Energy Policy. The piece may be subject to further revision. Contributions to SIPA for the benefit of CGEP are general use gifts, which gives the Center discretion in how it allocates these funds. Rare cases of sponsored projects are clearly indicated.
For a full list of financial supporters of the Center on Global Energy Policy at Columbia University SIPA, please visit our website at Our Partners. See below a list of members that are currently in CGEP’s Visionary Circle. This list is updated periodically.
The clean energy transition will drive considerable critical minerals demand growth. If critical minerals production and processing supply cannot keep up with the accelerating adoption of batteries, electric vehicles (EVs), wind turbines, and solar photovoltaic (PV) technologies, the global energy system transformation could be meaningfully delayed. In this Q&A, the authors draw on the data underlying the International Energy Agency’s (IEA) The Role of Critical Minerals in Clean Energy Transitions report, Net Zero Emissions (NZE) Scenario in its Net Zero by 2050 report, and Energy Technology Perspectives 2023[1] to explore what it will take to supply the technologies for achieving a net-zero emissions energy system by 2050.
Which technologies will drive critical mineral demand growth?
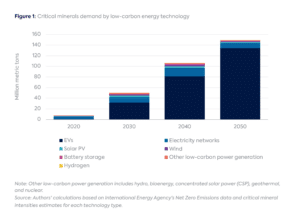
The most significant driver of critical minerals demand growth under the NZE scenario is EVs (Figure 1). Critical minerals demand for EVs alone is expected to grow by almost 300 times between 2020 and 2050. In the IEA NZE scenario, EV sales see more than a 50-fold increase during this period, with no new sales of internal combustion engine cars globally by 2035, and the share of EVs in total new passenger car sales reaching 64 percent by 2030 and 100 percent by 2035. Other segments (two/three-wheelers, buses, vans, heavy trucks) will follow suit in the near term, with EVs comprising 100 percent of total vehicle sales by 2050.
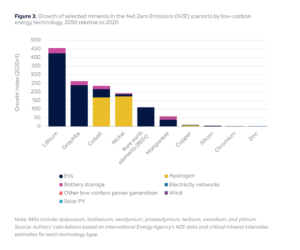
Assuming that the chemistry of batteries remains roughly the same through 2050 and steady improvement of critical mineral intensity per EV over the coming decades, these minerals (ordered most to least) will see more than 100-fold increase in demand: lithium, graphite, cobalt, nickel, and rare earth elements (REEs). It is worth noting that there are uncertainties in how the EV stock and mineral intensity per vehcile will evolve through 2040 and beyond. There could be breakthrough innovations in new battery chemistry reducing critical mineral requirements, accelerated mineral recycling trends, shifts to smaller battery capacity per vehicle (reducing vehicle range growth), and modal shifts reducing EV mileage. There are new, advanced battery technologies in the research and development stage that use more minerals in their manufacturing, which may further boost particular mineral demand in the future.
Other significant drivers include solar and wind power. Under the NZE scenario, solar photovoltaic (PV) capacity is expected to increase 20-fold between 2020 and 2050, from around 740 gigawatt (GW) to almost 15,000 GW. Absent significant innovation, this growth would double the minerals needed for solar PV panels production, even when the mineral intensity per unit of installed capacity reduces. For its part, wind capacity is expected to increase 10-fold, from around 740 GW to around 8,000 GW, doubling the requisite minerals for wind turbine manufacturing.
Hydrogen will play a relatively less prominent role in terms of absolute critical minerals demand growth, though the minerals needed for electrolysis and fuel cell electric vehicles (FCEVs) will still need to increase significantly by 2050.
Which minerals are needed most and in what quantities?
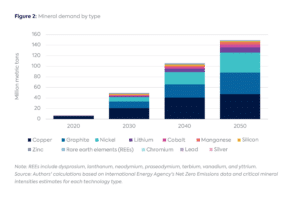
Among all critical minerals, lithium, graphite, cobalt, nickel, REEs, manganese, copper, silicon, chromium, and zinc require the largest percentage growth by 2050 to meet the demand of growing low-carbon energy technology under the NZE. The demand for these minerals collectively is expected to increase almost 20-fold between 2020 and 2050, from less than 10 million metric tons (Mt) to roughly 150 Mt (Figure 2). During the same period, critical minerals required for battery storage are anticipated to see a nearly 40-fold increase, while those required for low-carbon electric power generation are expected to triple. Mineral demand for low-carbon generation will likely see the most significant growth between 2020 and 2030 before slowing down.
Copper, necessary for nearly all of the clean technologies analyzed here, is estimated to see a demand growth from 5 Mt today to around 50 Mt in 2050 in the NZE scenario. Nickel is widely used not only for EVs and battery storage but also in low-carbon generation and hydrogen infrastructure. It is set to play an important role in the clean energy transition, with demand growing from 200 thousand metric tons (kt) today to almost 40 Mt by 2050. REEs are primarily used in EVs and wind technology. Starting at a low base of 6 kt demand today, around 700 kt will be required by 2050.
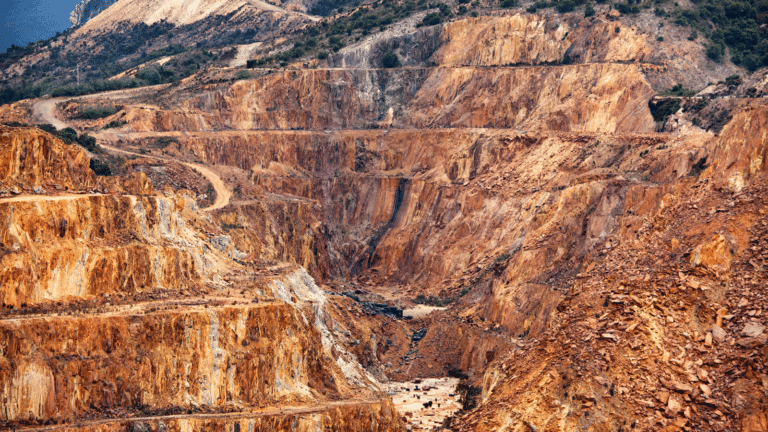
Where are the reserves and resources of these critical minerals, and how much of each mineral is currently available?
Mineral reserves and resources are generally dispersed globally, but certain key minerals are concentrated in a few regions.
Global lithium reserves are about 22 Mt, roughly half of which are located in Chile. Australia has the second-most significant share, accounting for around 20 percent, followed by Argentina (9 percent), China (7 percent), and the United States (4 percent). Identified lithium resources amount to around 89 Mt, mostly located in Bolivia (21 Mt), Argentina (19 Mt), Chile (10 Mt), and Australia (7 Mt).[2]
The world’s graphite reserves amount to 320 Mt, mainly in Turkey (28 percent), China (23 percent), and Brazil (21 percent). Identified recoverable graphite resources exceed 800 Mt.[3]
Global cobalt reserves currently amount to 7.6 Mt, mostly located in the Democratic Republic of the Congo (46 percent), followed by Australia (18 percent) and Indonesia (8 percent). Identified world terrestrial cobalt resources stand at about 25 Mt. The vast majority of these are in Congo and Zambia, with lesser amounts in Australia, Canada, Russia, and the US. More than 120 Mt of cobalt resources are located on the floor of the Atlantic, Indian, and Pacific Oceans.[4]
Total world nickel reserves are estimated to exceed 95 Mt, with most located in Indonesia (22 percent), Australia (22 percent), Brazil (17 percent), and Russia (8 percent). Identified land-based nickel resources amount to 300 Mt, with more discoverable on the ocean floor.[5]
Total REE reserves around the world amount to roughly 120 Mt, concentrated in China (37 percent), Vietnam (18 percent), Russia (18 percent), and Brazil (18 percent). REEs are relatively abundant in the earth’s crust, but minable concentrations are less common than for most of the other minerals. Known resources in the US stand at around 2.4 Mt, and around 15 Mt in Canada.[6]
Total manganese reserves around the world amount to about 1.5 Mt, with South Africa accounting for roughly 40 percent of total reserves followed by Australia (18 percent) and Brazil (18 percent). In terms of resources, land-based manganese resources are large (though the exact amount is unknown) and irregularly distributed. Those in the US are very low grade and may have high extraction costs.[7]
Total copper reserves around the world stand at around 880 kt, found in Chile (23 percent), Australia (11 percent), Peru (9 percent) and Russia (7 percent). According to the latest data, identified world copper resources amount to around 2.1 billion tons, and undiscovered resources around 3.5 billion tons.[8]
Which countries currently control the production and processing of critical minerals and what are the implications?
In the case of lithium, cobalt, and REEs, the top three producing countries control more than 75 percent of total global output. For instance, South Africa and the Democratic Republic of the Congo are responsible for around 70 percent of global platinum and cobalt production, respectively. Similarly, in 2019, China was responsible for almost 60 percent of global REE production.
In the case of copper and nickel, around half of global production is concentrated in the top three countries: Chile, Peru, and China for copper; and Indonesia, the Philippines, and Russia for nickel.
Processing and refining operations are even more concentrated given China’s strong presence. China’s share of refining is around 35 percent for nickel (or higher if one includes the involvement of Chinese companies in Indonesian operations), 60 percent for lithium, 70 percent for cobalt, and as high as 90 percent for REEs.
Comparing global production capacity of mines in operation and under construction with the critical mineral demand growth implicit under the NZE scenario, it is clear that there will be a gap in production capacity for copper, lithium, and cobalt by 2025. Mine production capacity now requires accelerated investment and expansion to meet the critical mineral demand growth implicit in the NZE scenario. Any critical mineral supply bottleneck will present a binding constraint on the feasibility of achieving the net-zero target.
Foundations and Individual Donors Anonymous Anonymous the bedari collective Jay Bernstein Breakthrough Energy LLC Children’s Investment Fund Foundation (CIFF) Arjun Murti Ray Rothrock Kimberly and Scott Sheffield
Critical minerals were once again near the top of the agenda for G7 leaders as they met in Évian, France, this week, a year after the G7 launched the Critical Minerals Action Plan.
The US Export-Import Bank is preparing to close the first funding tranche of Project Vault, a public-private partnership establishing the US Strategic Critical Minerals Reserve.
This paper proposes a de-risking framework of policy interventions to provide the risk allocation, revenue certainty and delivery confidence required by mainstream private finance.