Trump is frustrated gasoline prices don’t mirror oil’s decline. Experts say it’s not that simple
U.S. gasoline prices decreased an average of 49 cents a gallon in the last month as expectations rose for an end to the war with Iran.
Get the latest as our experts share their insights on global energy policy.
This Energy Explained post represents the research and views of the author(s). It does not necessarily represent the views of the Center on Global Energy Policy. The piece...

Hear in-depth conversations with the world’s top energy and climate leaders from government, business, academia, and civil society.
The energy transition is in the midst of its own transition. Spiking electricity demand and geopolitical events are driving up energy prices, while debates over the best sources...

Fact Sheet by Diana Hernández, Qëndresa Krasniqi & Alexandra Peek • October 26, 2023
Energy insecurity (EI)is defined as the inability to adequately meet household energy needs.
EI has three dimensions:[1]
Among all US households in 2020, 33.53 million experienced some form of EI. More specifically[2]
Although EI is widespread in the US, it is not equally distributed across all populations; disparities exist by race and ethnicity, income and wealth, and housing characteristics.[5]
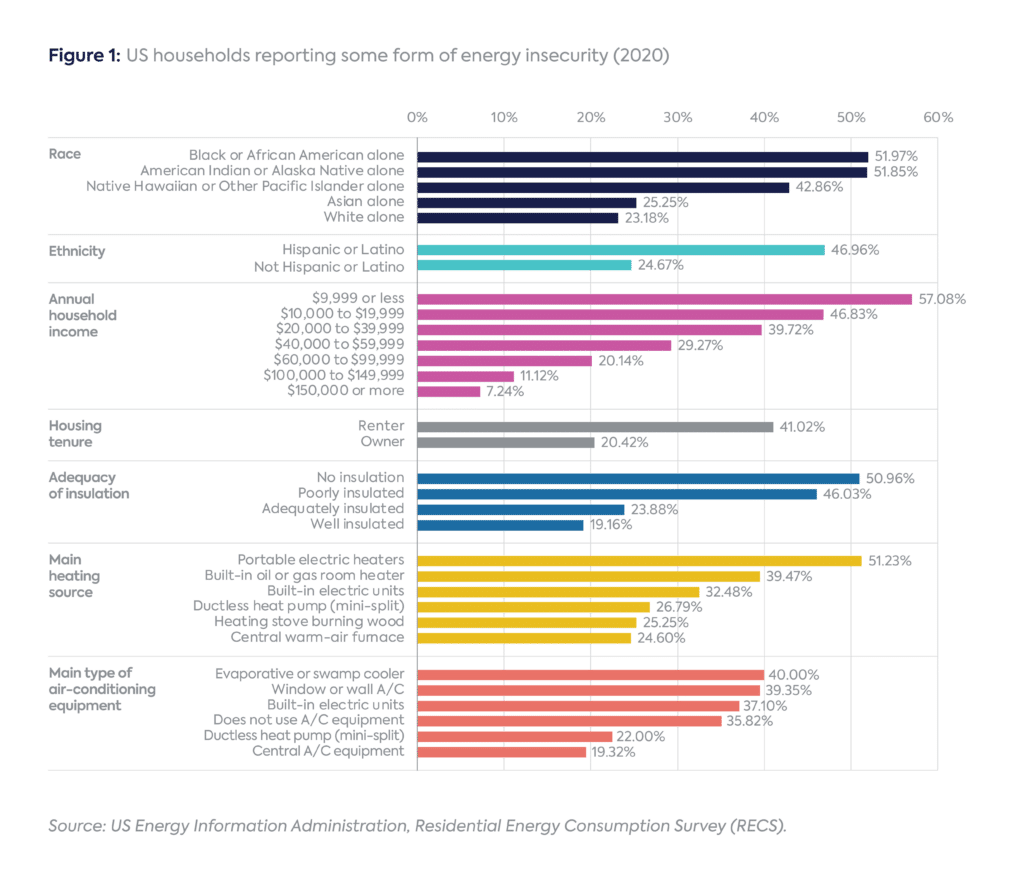
Race and ethnicity. In 2020, Black and Indigenous populations were more than twice as likely as other groups to experience EI. Compared to 23 percent of white households, 52 percent of Black and American Indian or Alaska Native households experienced some form of EI (see Figure 1). Nearly half (47 percent) of Hispanic households experienced some form of EI compared to 25 percent of non-Hispanic households.[6]
Income and wealth. More than half (51 percent) of households making less than $20,000 a year reported experiencing energy insecurity in 2020. As Figure 1 shows, this percentage decreases steadily as income increases.[7] For example, households earning less than $20,000 a year were seven times more likely to experience EI than those making $100,000 a year or greater.[8]
Housing Characteristics. Renters were twice as likely as owners to experience EI—41 versus 20 percent. Furthermore, 47 percent of households living in poorly insulated homes, 51 percent of those using portable electric heaters as a main heating source, and about 40 percent of those using inefficient cooling (i.e., swamp coolers and window A/C units) experienced some form of EI.
Addressing EI requires improving the physical condition of housing and reducing cost burdens. Specific measures to be taken include:
[1] Diana Hernández, “Understanding ‘Energy Insecurity’ and Why It Matters to Health,” Social Science & Medicine 167 (October 1, 2016): 1–10, https://doi.org/10.1016/j.socscimed.2016.08.029.
[2] US Energy Information Administration (EIA), “2020 Residential Energy Consumption Survey,” accessed October 14, 2022, https://www.eia.gov/consumption/residential/data/2020/.
[3] Includes inability to use air-conditioning equipment at any time during the previous 12 months because equipment was broken and household could not have it repaired or because of an electricity disruption due to lack of payment.
[4] Includes inability to use main heating equipment at any time during the previous 12 months because equipment was broken and household could not have it repaired or because of an electricity, natural gas, or bulk fuel disruption due to lack of payment.
[5] EIA, “2020 Residential Energy Consumption Survey.”
[6] Ibid.
[7] Ibid.
[8] Carolyn Hronis and D Ross Beall, “Who’s Energy Insecure? Results from the 2020 Residential Energy Consumption Survey (RECS),” n.d., 16.
Most African countries today are faced with a dual challenge: how to industrialize and expand electricity access at the same time.

Artificial intelligence is driving a massive technological transformation that is already reshaping many aspects of daily life.
30 years ago last month, a brutal heatwave struck Chicago, killing more than 700 residents. As the city and much of the United States recently experienced another period of extreme heat, this anniversary serves as a reminder that heat remains one of the deadliest climate-related hazards — killing more people each year than hurricanes, floods and tornadoes combined — particularly for communities burdened by decades of disinvestment and structural barriers to health and safety.

Full report
Fact Sheet by Diana Hernández, Qëndresa Krasniqi & Alexandra Peek • October 26, 2023